
Portfolio Tracker Spreadsheet
In 2023, I retired at 55 because I built a smart, sustainable investment strategy centered around dividend stocks. And one of the biggest game-changers in my journey wasn’t just the dividend stocks I picked — it was this spreadsheet. I created it to keep every piece of our investment portfolio organized, clear, and working for us 24/7. It gives me total visibility, keeps me disciplined, and helps me stay laser-focused on growing wealth over time. This isn’t just a spreadsheet — it’s the heartbeat of my investment strategy, and I wouldn’t manage my portfolio without it.
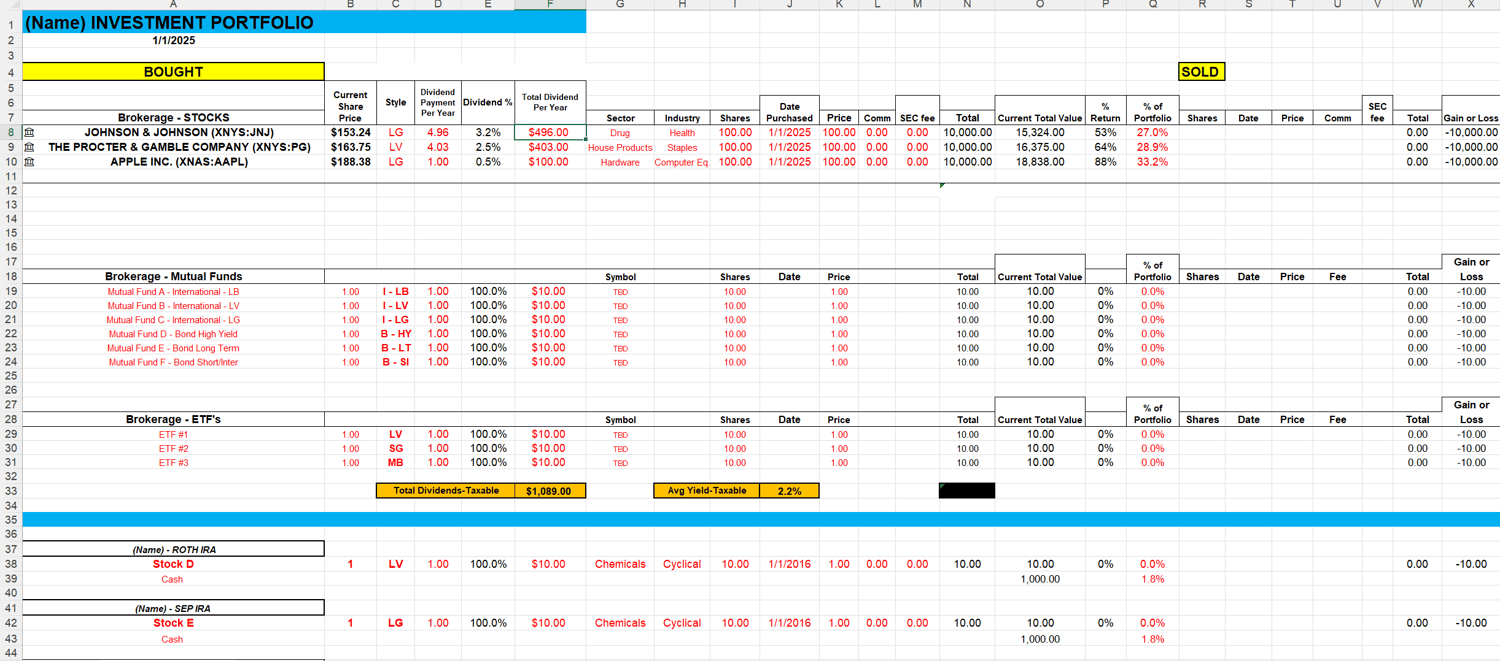
This spreadsheet will help experienced investors track their portfolios on a monthly basis and maintain long-term diversification. A basic understanding of Excel is essential for purchasing and using this spreadsheet effectively.
This spreadsheet is designed to be updated when you purchase or sell a security. The Current Share Price" Column B automatically updates when you open the spreadsheet. In one glance, you will have a panoramic view of your entire portfolio.
The Portfolio Tracker spreadsheet includes multiple formulas. When you purchase a stock, simply complete the following columns (complete the fields highlighted in Red in the spreadsheet):
- Column A - Type the name of the stock and go to Data and choose Stocks, then choose the correct security name on the right side of Excel (sometimes Excel will automatically update the cell correctly with the right security name). This will update the current stock price in Column B every time you open the spreadsheet.
- Column B – Current Share Price – copy formula from a cell that is working correctly.
- Style (get from Morningstar)
- Dividend Payment Per Year (get from Yahoo)
- Sector (get from Morningstar)
- Industry (get from Morningstar)
- Shares (number of shares purchased)
- Date (date purchased stock)
- Price (price purchased stock)
- Commission (if any)
- Update and change the formula in "% of Portfolio"
- Add your new stock (column Q) to the Diversification formula at the bottom of the spreadsheet
Lastly, when you start to use the spreadsheet, in the Diversification model at the bottom, fill in the red rows with your model percentages for the Large, Medium, Small, Bonds and International categories. This allows you to develop and monitor your own diversification model.
Good luck and enjoy watching your portfolio flourish over the long term!