Computational Simulation, Central Limit Theorem
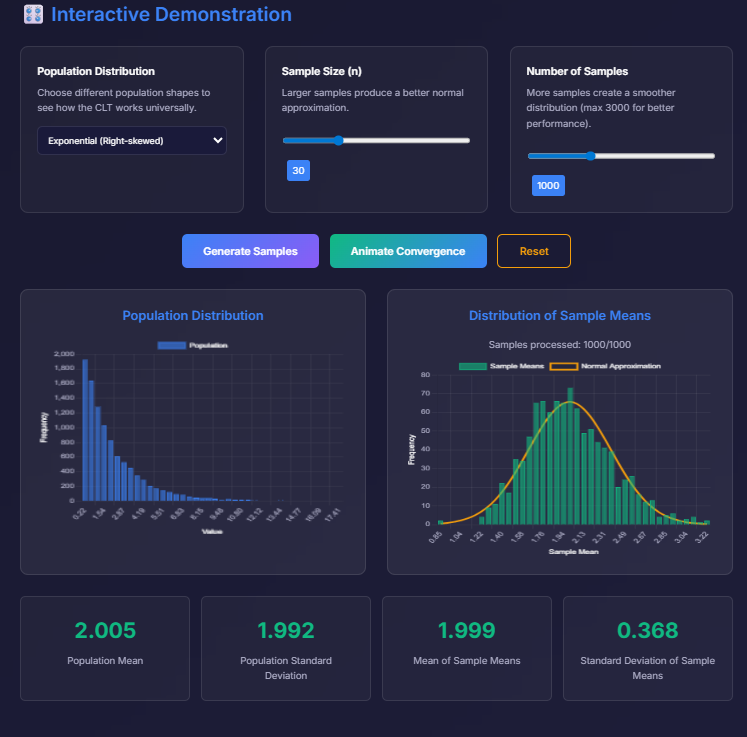
Discover the power of statistics in your store with our new interactive demonstration of the Central Limit Theorem! Dynamically visualize how, by taking samples from any distribution, the averages approach a normal curve, regardless of the original shape of the data. With intuitive controls for sample size and the number of samples, you can experience the “miracle” of statistical convergence in real time.
Surprise your customers with clear graphs and instantly updated metrics: compare the original data distribution, observe the evolution of sample means, and understand key concepts like mean and standard deviation in a simple and visual way. Perfect for classrooms, training sessions, or anyone curious about data science.
Make statistics a tangible, educational, and fun experience in your virtual store!