





Risks Heatmap Dashboard
Risk & Issue Heatmap Dashboard
See your whole risk position in one picture — before treatment and after.
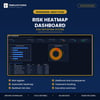
Two live 5×5 heatmaps sit at the centre of this workbook: one for inherent risk, one for residual. Enter a risk, rate it, and both maps fill themselves. The gap between them is the honest measure of whether your treatments are actually working.
What's inside
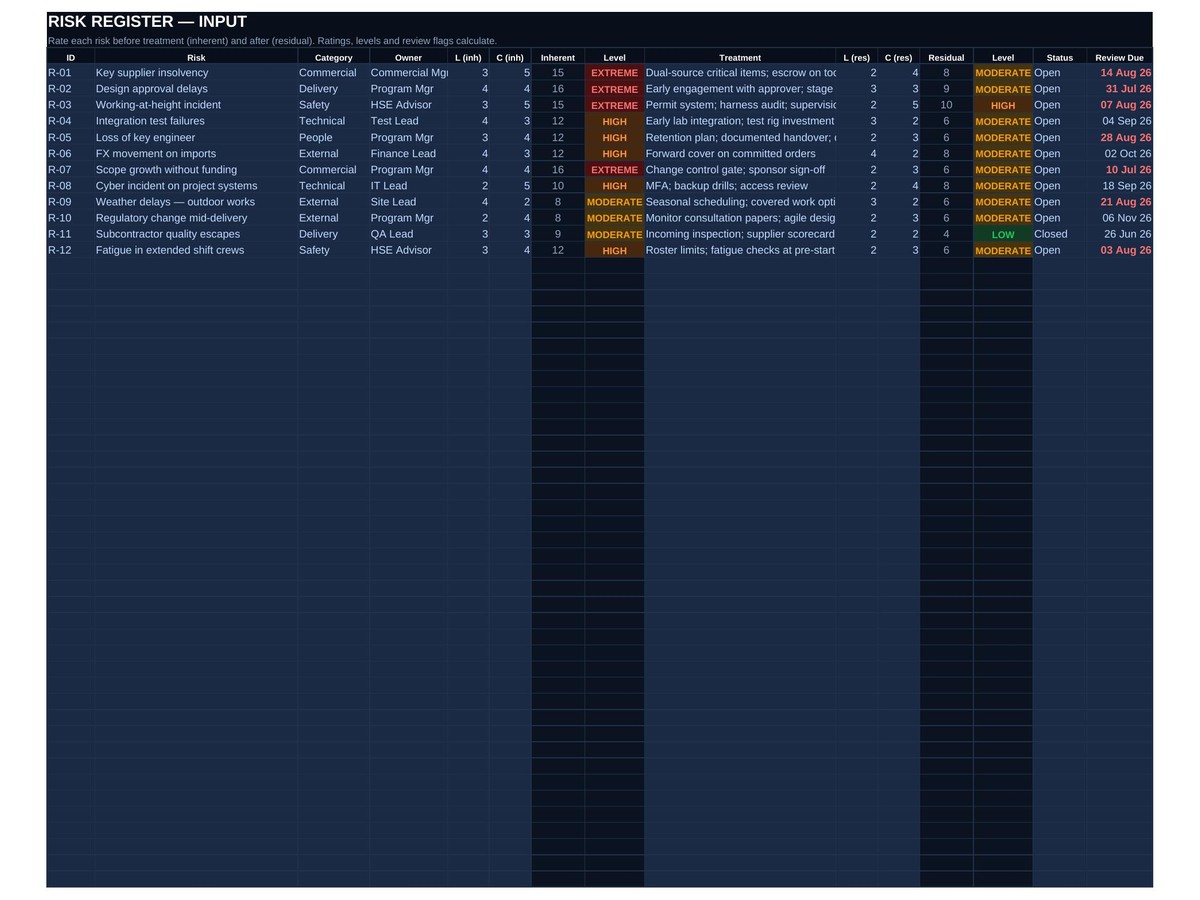
- Risk register — every risk with owner, category, status and treatment
- Inherent heatmap — the 5×5 picture before any treatment, with live counts in every cell
- Residual heatmap — the same picture after treatment, so the effect is visible
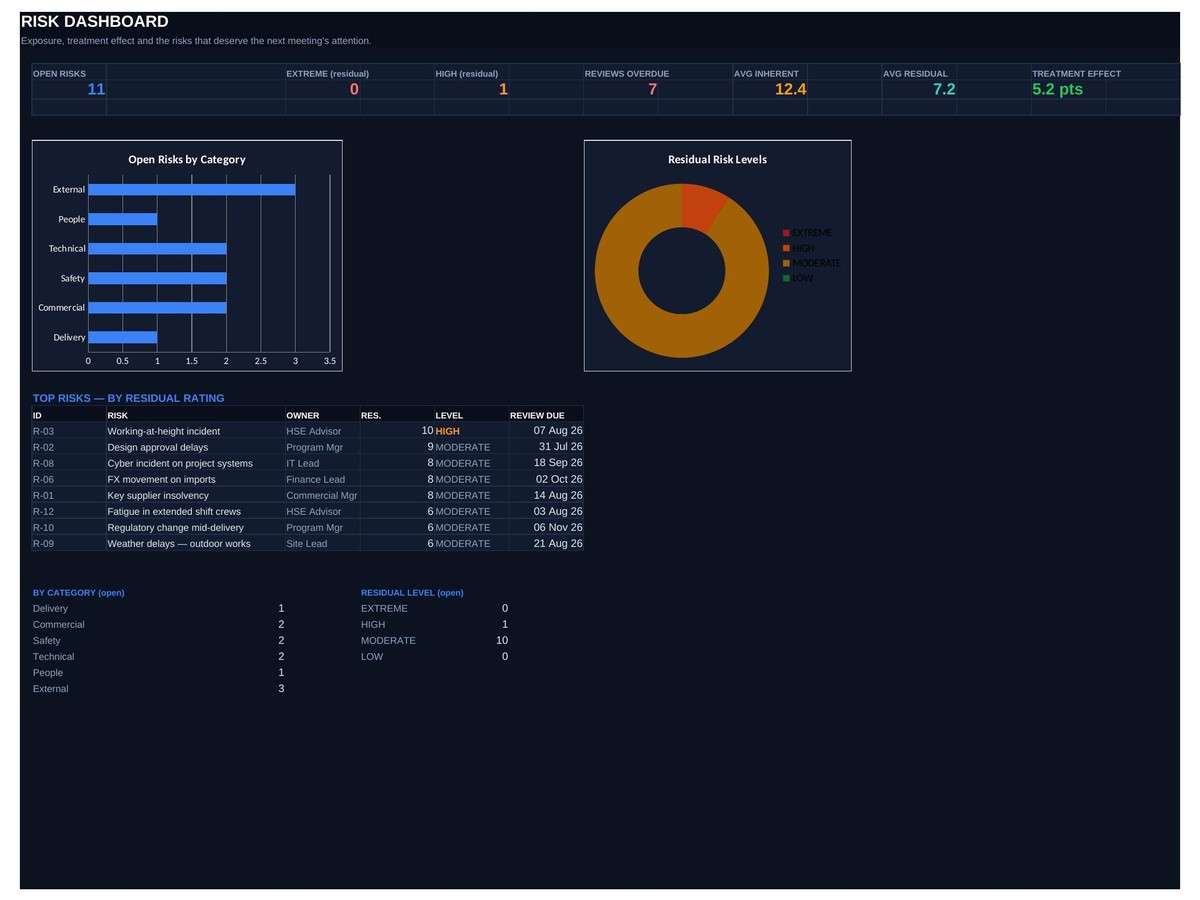
- Treatment effect — how far your actions have actually moved the exposure
- Top risks table — the ones that need attention now, ranked automatically
- Issue tracking — issues alongside the risks that became them
How it works
Set your likelihood and consequence scales once, then enter risks. The maps, counts and rankings all calculate. No macros, no add-ins, no subscription — a normal Excel file that opens on any version of Excel and keeps working forever.
Built in Australia from more than twenty years of program delivery experience. Instant download, yours to keep, use it on as many projects as you like.