

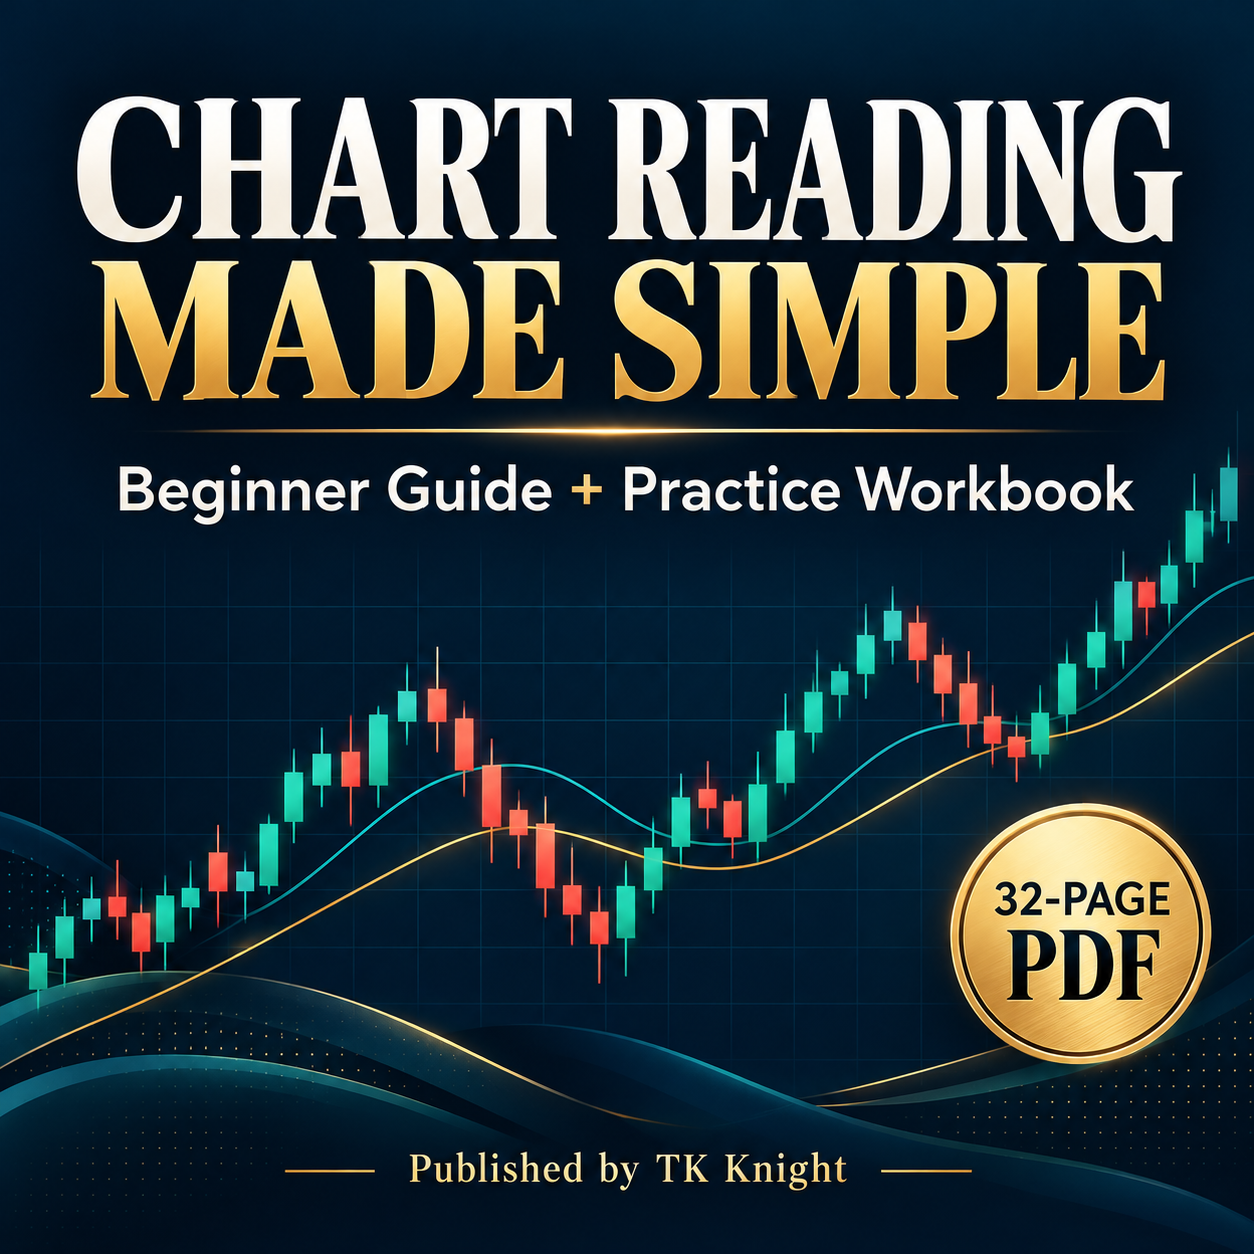
Chart Reading Made Simple: Beginner Stock Chart Guide + Practice Workbook
Chart Reading Made Simple: Your Beginner’s Guide to Understanding Stock Charts
Stop feeling overwhelmed by stock charts. Start understanding what you’re looking at.
This 32-page illustrated guide and practice workbook helps you make sense of candlesticks, price movements, trends, and common indicators—one clear lesson at a time. No prior charting knowledge is needed.
Learn how to:
- Read prices, chart settings, and candlesticks.
- Recognize trends and identify support and resistance.
- Understand volume, moving averages, RSI, MACD, and volatility.
- Compare timeframes and recognize why chart signals can be misleading.
- Follow a repeatable routine to explain what a chart is showing.
Put your learning into practice. Your PDF includes visual lessons, a chart-pattern gallery, a guided lab with a model solution, six practice cases with answers, printable worksheets, a review journal, and a quick-reference page.
A seven-session study plan helps you work through the material at your own pace. Read it on your device or print the study pages and take notes as you learn.
Whether you’re opening your first stock chart or want a clearer understanding of the basics, this guide gives you a structured place to start.
Download your copy and take the first step toward understanding stock charts with greater confidence.
Digital PDF download only; no physical book. Worksheets are printable, not interactive fillable forms. All charts use fictional educational examples. This guide provides education, not personalized investment advice, stock picks, trading signals, or guaranteed results. Videos and coaching are not included.