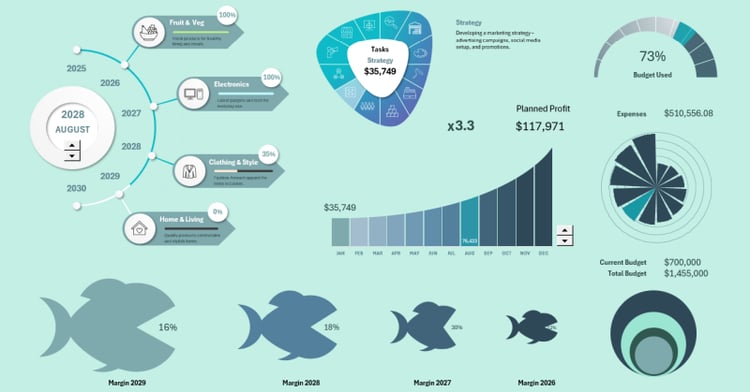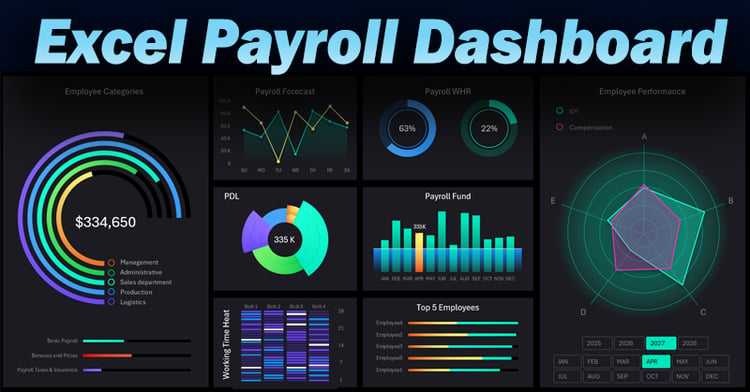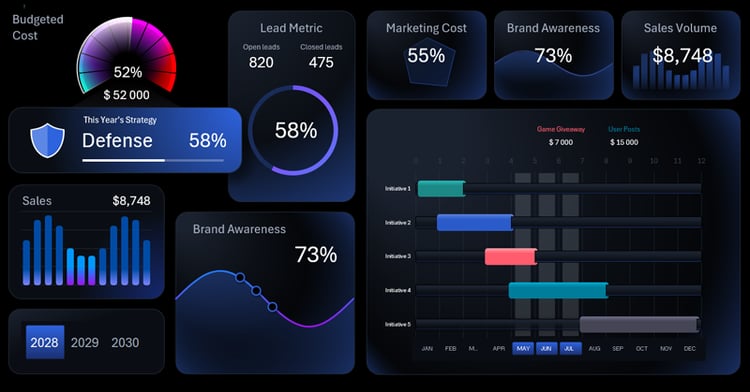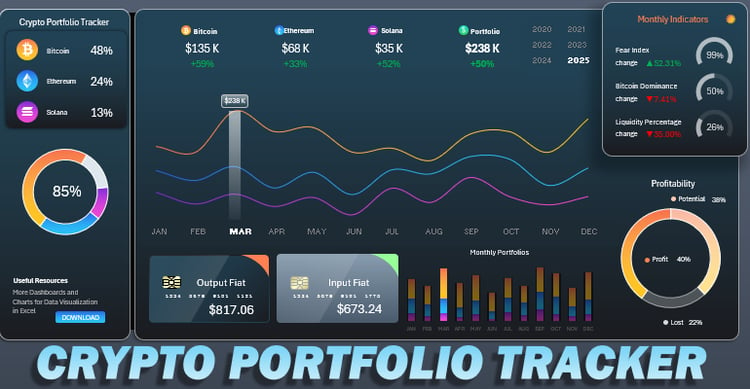

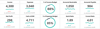
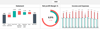
Profit & Loss Dashboard for Data-Driven Financial Decisions
On Sale
$30.00
$30.00
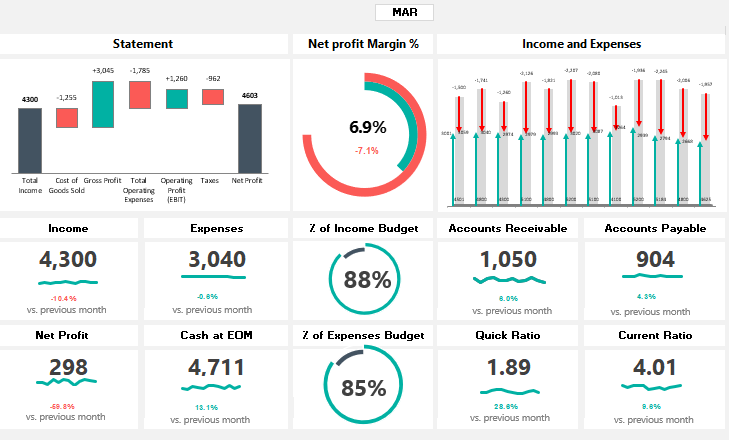
Gain full visibility into your company’s financial performance with a professional Profit & Loss (P&L) Dashboard designed to support faster, smarter business decisions.
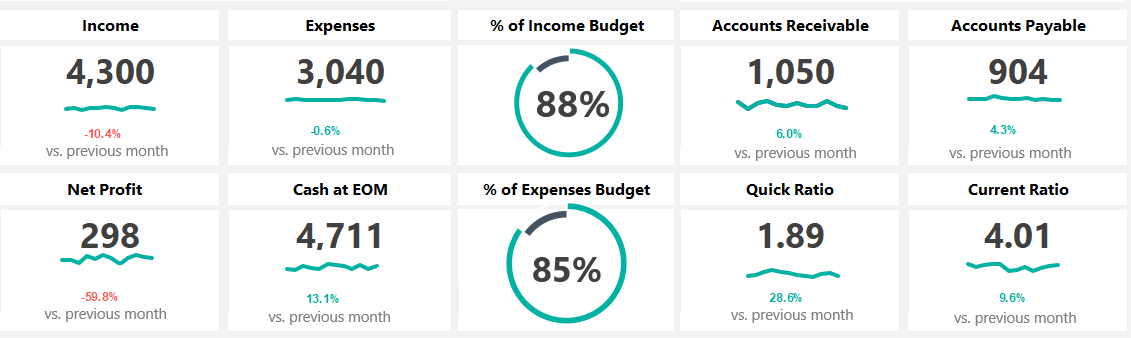
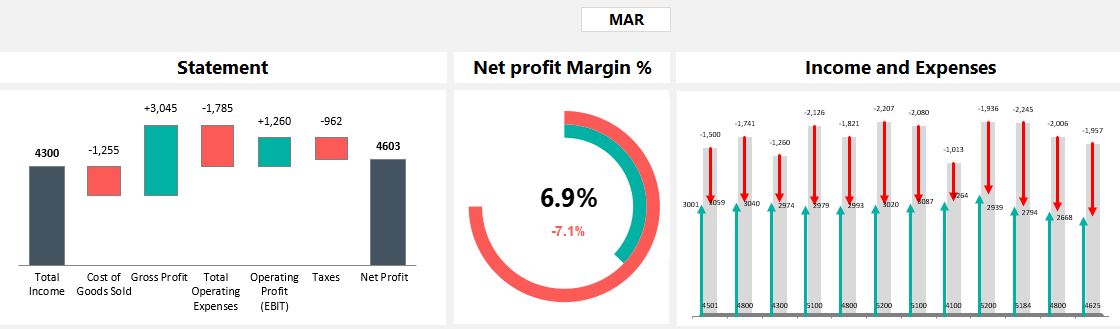
This dashboard consolidates revenue, costs, and profitability data into a clear, executive-ready view, allowing finance teams and decision-makers to quickly assess performance, identify trends, and track profitability drivers.
🔍 Key Features:
- 📊 Revenue, cost & profit breakdown in a single view
- 📈 Period-over-period performance analysis
- 🎯 Gross margin & net profit insights
- 🗂️ Departmental or category-based P&L analysis
- ⚡ Excel-based, easy to customize & update
- 📑 Clean visuals suitable for management reports
🎯 Ideal For:
- Finance & Accounting Teams
- Business Owners & Executives
- FP&A & Financial Analysts
- Management Reporting
💡 Why This Dashboard?
✔ Improves financial clarity & visibility
✔ Supports data-driven strategic decisions
✔ Reduces manual reporting time
✔ No complex tools or coding required
📥 Instant download – Ready to use for your business