







Scaling In and Out Explained — Measured (PDF Guide)
You were told to take partial exits, move the stop to breakeven, or trail it behind price - and none of that advice comes with a control. Changing the exit changes what counts as a win, which is exactly why the usual comparisons settle nothing.
This guide measures four exit policies against their own controls on 112,130 bars, prints the two errors the study caught in itself - one of which changed a result's sign - and shows why one number cannot rank policies whose endings are not the same size. This is a 45-page PDF that teaches Scaling In and Out from the first thing you see on the screen through to a written strategy with an entry, a stop and an explicit rule for when the trade is wrong.
Nothing is taught underneath a chart. Every label sits on the candle, the line or the level it is describing, on real BTC, ETH, SOL and LINK charts. There are three quizzes on real charts, each followed by the same chart re-shown annotated with the reasoning, plus faded practice pages where the first steps are filled in and you finish the rest.
WHAT'S INSIDE
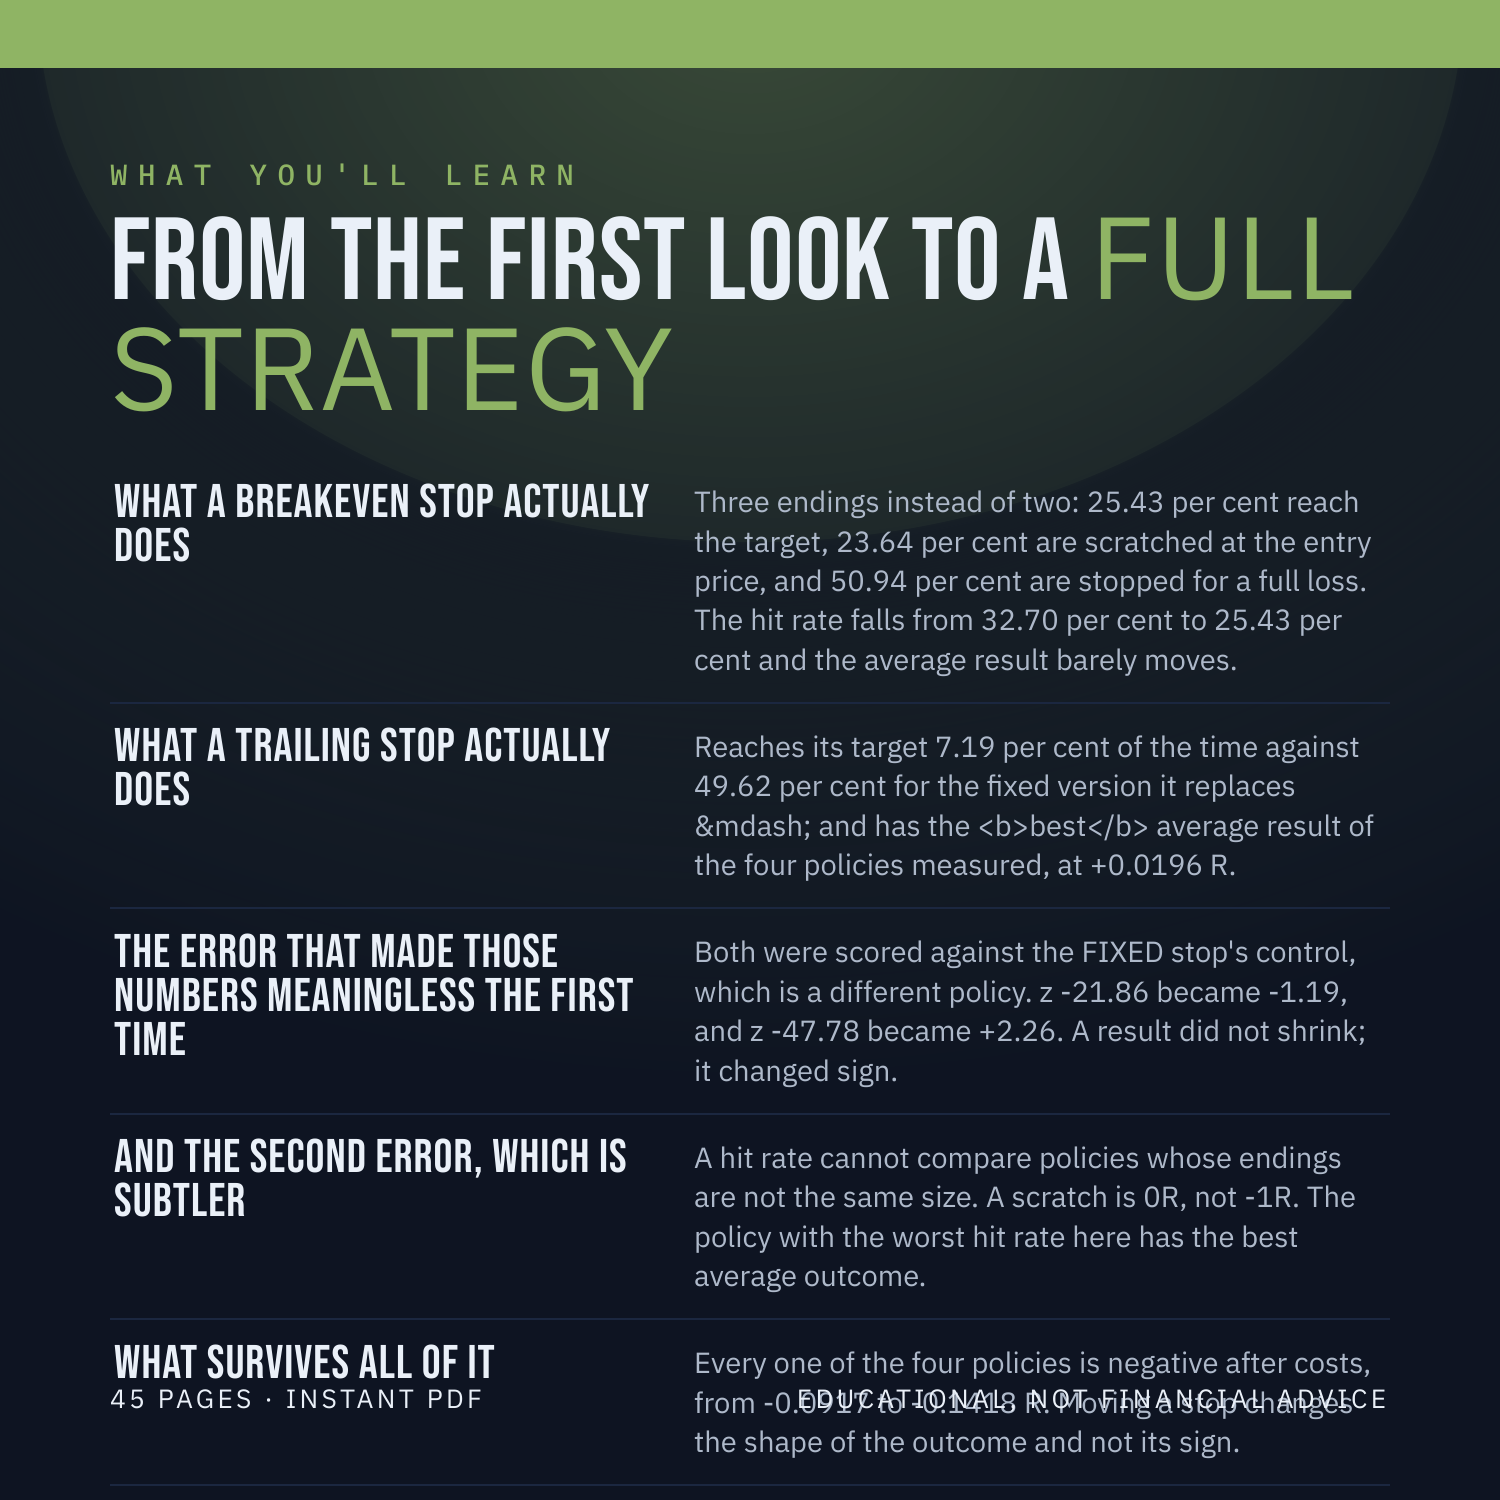
What a breakeven stop actually does -- Three endings instead of two: 25.43 per cent reach the target, 23.64 per cent are scratched at the entry price, and 50.94 per cent are stopped for a full loss. The hit rate falls from 32.70 per cent to 25.43 per cent and the average result barely moves.
What a trailing stop actually does -- Reaches its target 7.19 per cent of the time against 49.62 per cent for the fixed version it replaces -- and has the best average result of the four policies measured, at +0.0196 R.
The error that made those numbers meaningless the first time -- Both were scored against the FIXED stop's control, which is a different policy. z -21.86 became -1.19, and z -47.78 became +2.26. A result did not shrink; it changed sign.
And the second error, which is subtler -- A hit rate cannot compare policies whose endings are not the same size. A scratch is 0R, not -1R. The policy with the worst hit rate here has the best average outcome.
What survives all of it -- Every one of the four policies is negative after costs, from -0.0917 to -0.1418 R. Moving a stop changes the shape of the outcome and not its sign.
WHAT YOU'LL BE ABLE TO DO
Say why a changed exit needs its own control.
Read a three-outcome policy without using a hit rate.
Compare two exit policies in R rather than in percentages.
Spot a result so large it is probably a measurement error.
Decide whether to move a stop for a reason you can state.
AN HONEST NOTE
Scaling In and Out is a clue, not a crystal ball. It describes what price has already done. This guide contains no win-rates, no backtest results and no promises about what you will make, because nobody can verify those and you should not trust anyone who prints them. What it hands you instead is a set of rules you can test yourself on TradingView in an afternoon. Educational, not financial advice.
Instant download. 45 pages, PDF.