

Vending Machine Business Profit Tracker
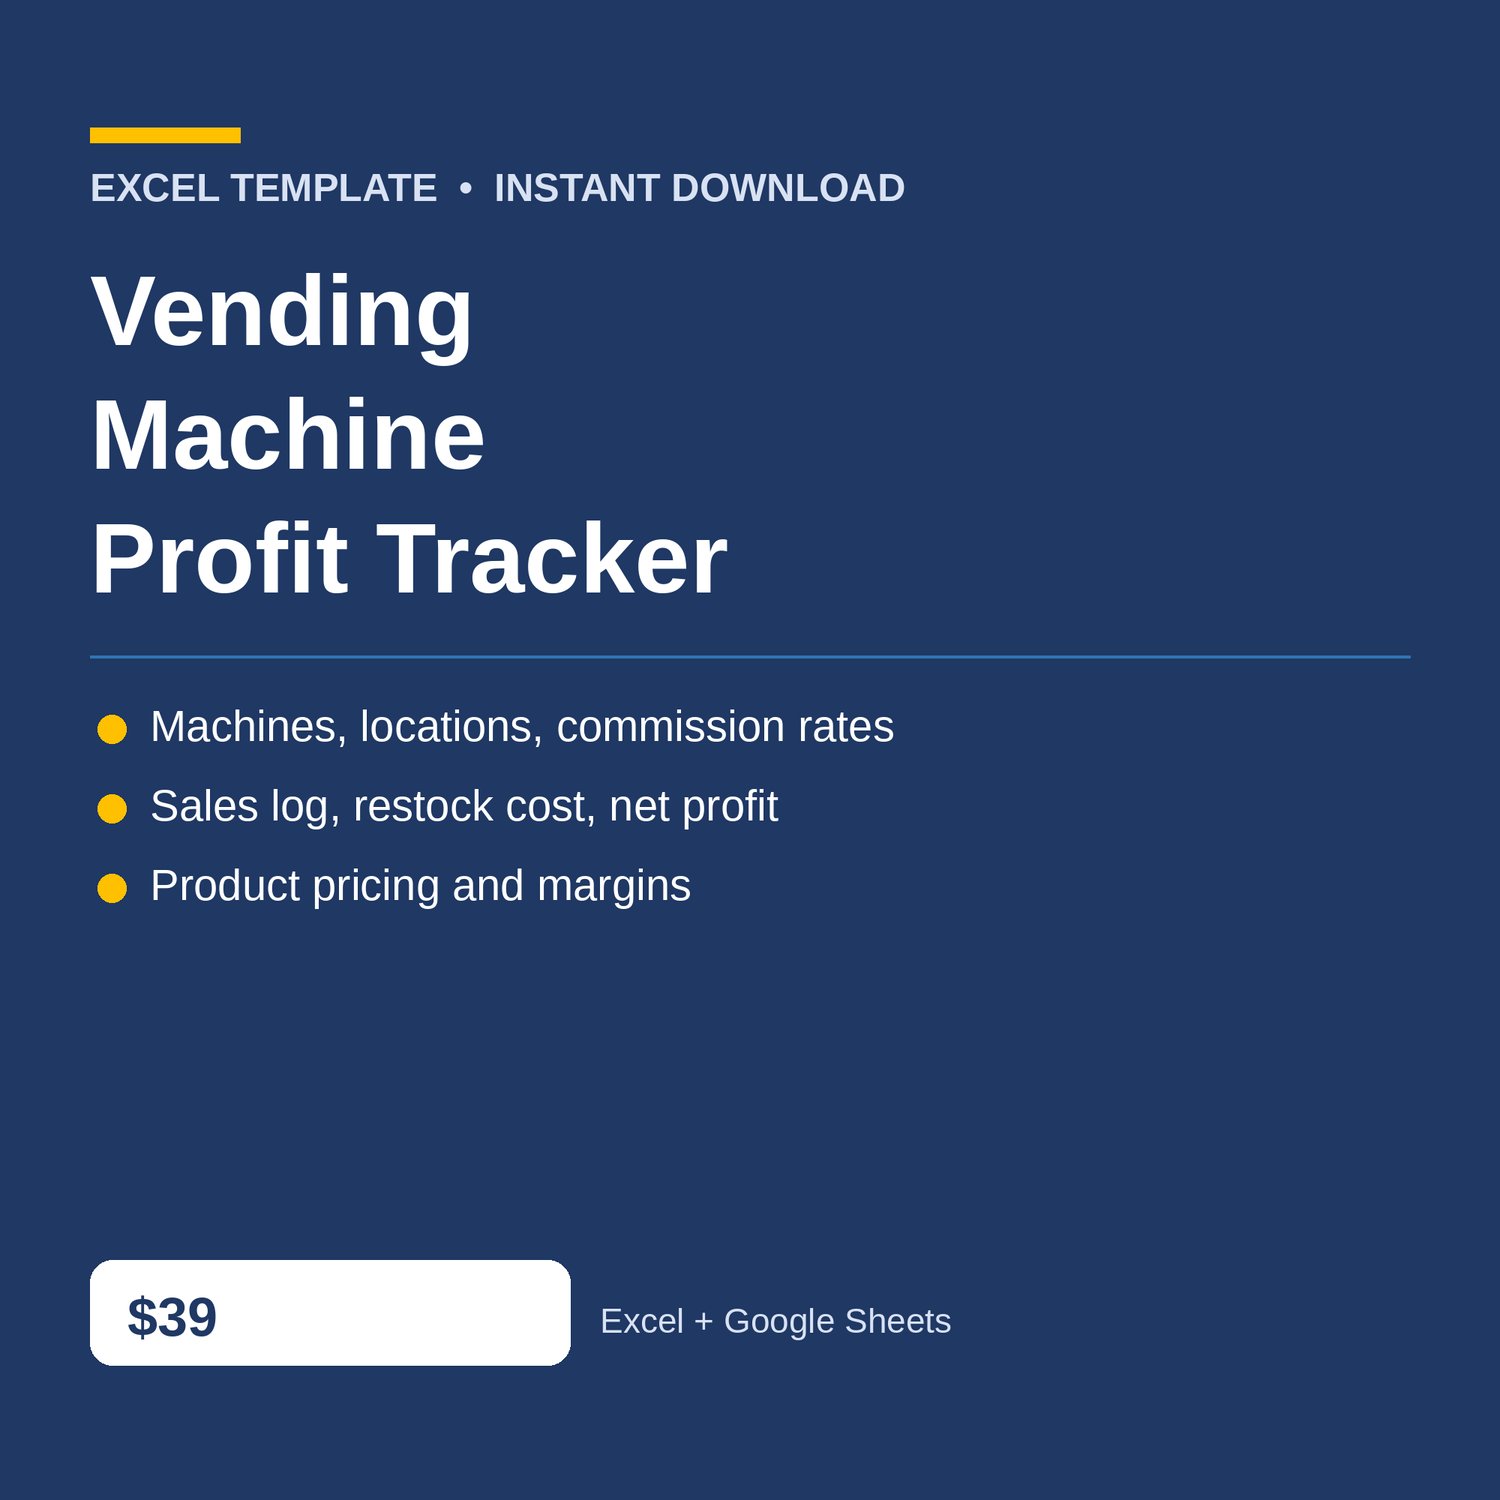
Vending Machine Profit Tracker Excel for your vending business — machines and locations, sales log, product pricing, and a monthly P and L dashboard. Know what every machine actually earns — and whether the month actually made money.
Built for vending route operators who need to know, machine by machine and product by product, whether the location commission leaves anything after the restock — without accounting software. If a location is eating the margin, this workbook shows it before the next contract renewal.
WHAT'S INCLUDED (6 sheets):
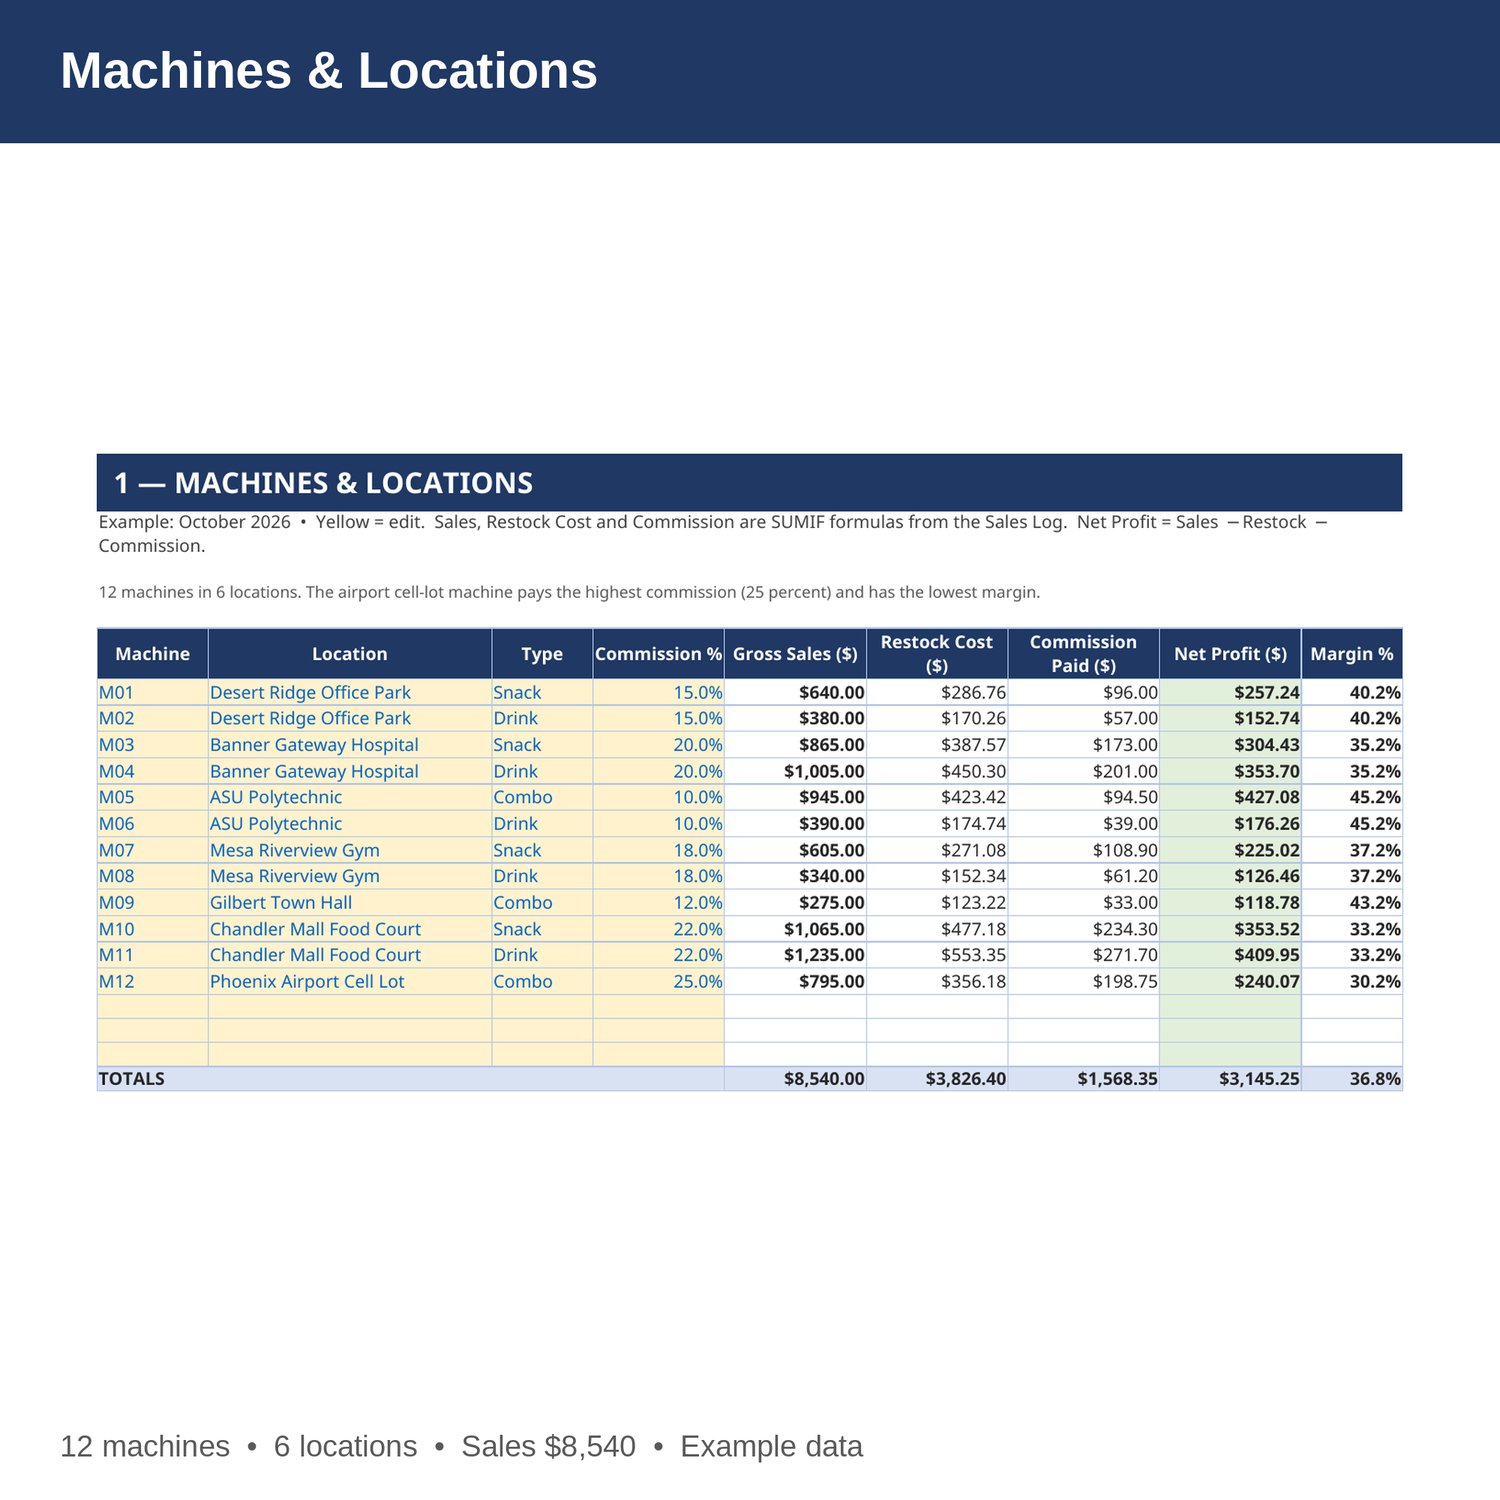
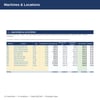
- Machines and Locations — machine, location, type, commission percent, gross sales, restock cost, commission paid, net profit and margin percent for every machine. All values are formulas from the Sales Log. Change a commission rate and every machine updates.
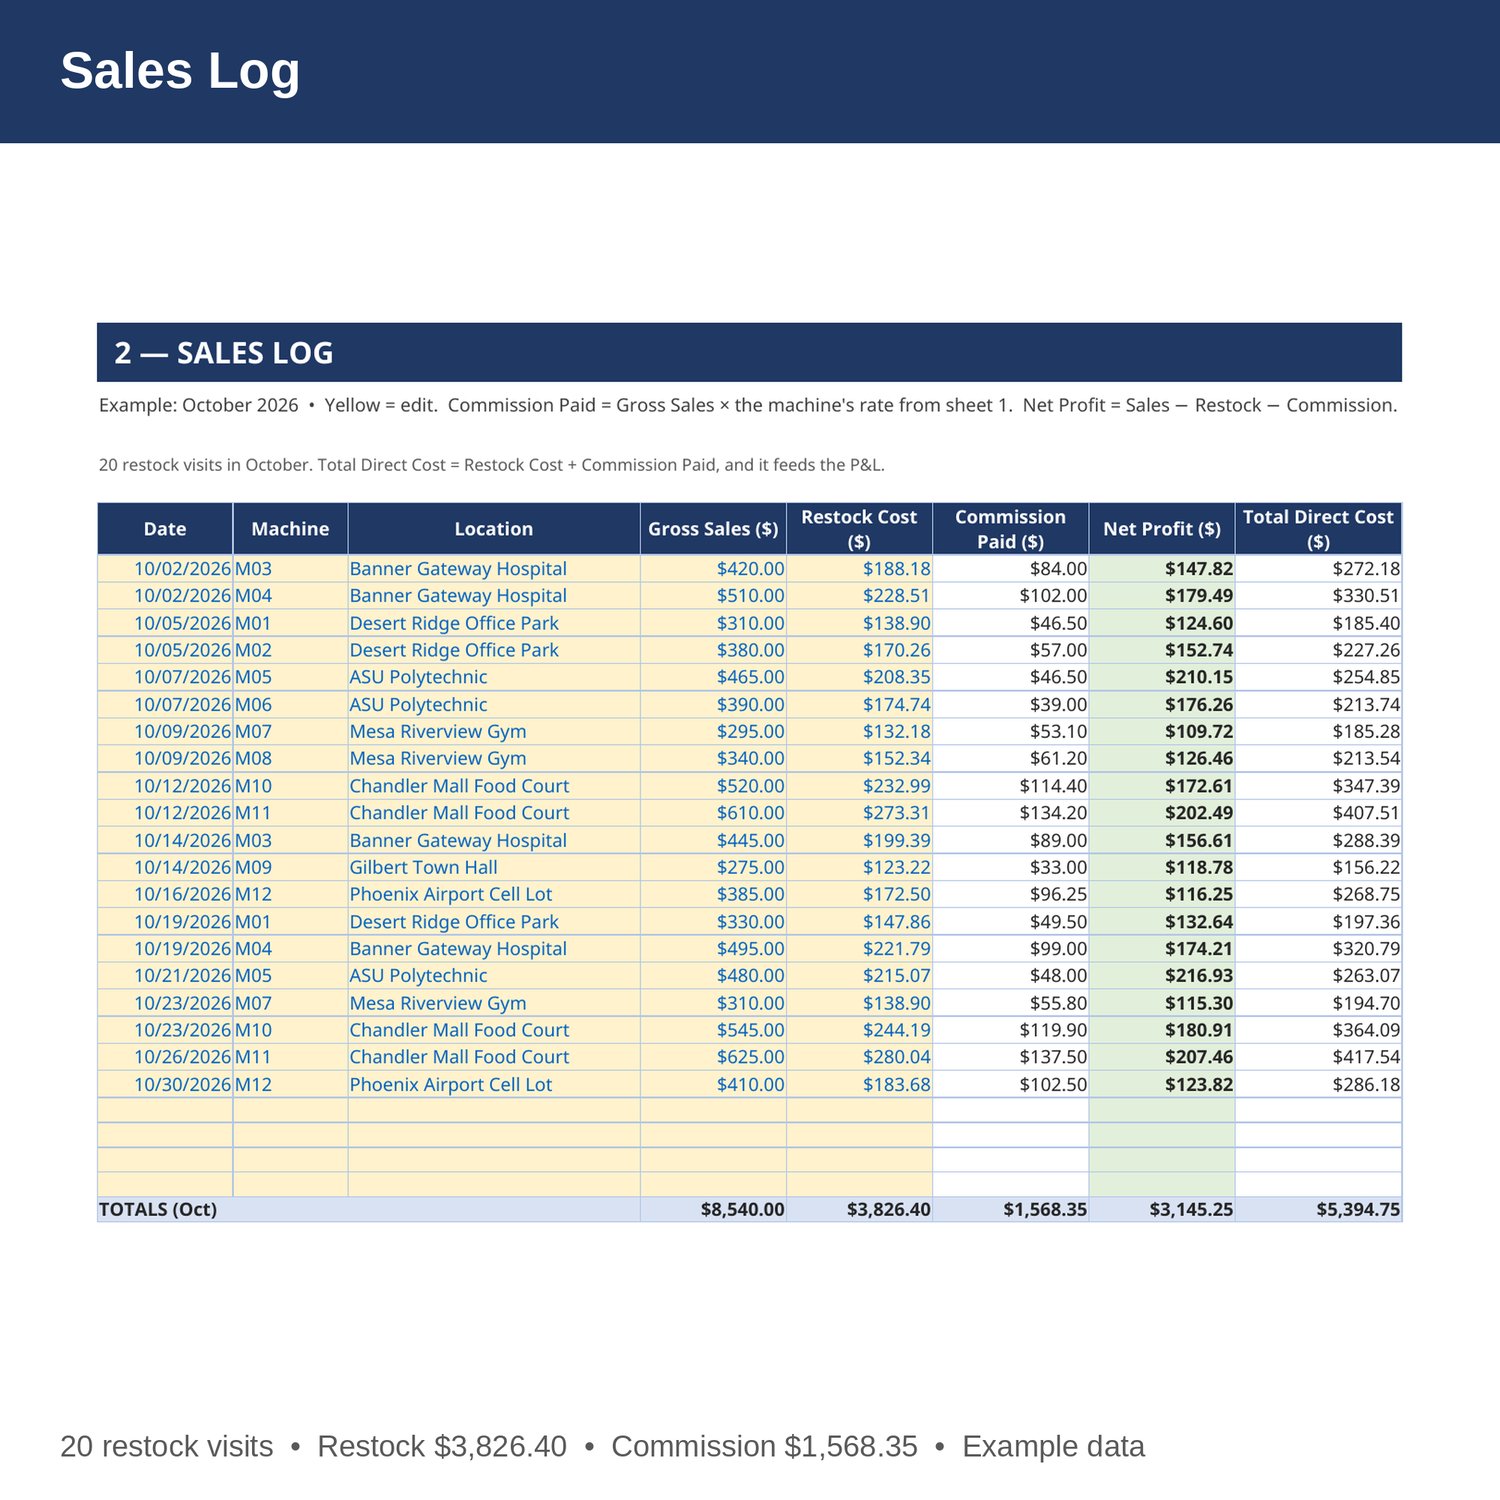
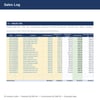
- Sales Log — date, machine, location, gross sales, restock cost, commission paid (by formula from the machine's rate), net profit, and total direct cost for every restock visit.
- Products and Pricing — product, price, cost, units sold, revenue, profit, margin percent, and machines stocked for every product. Change a price and the product totals update.
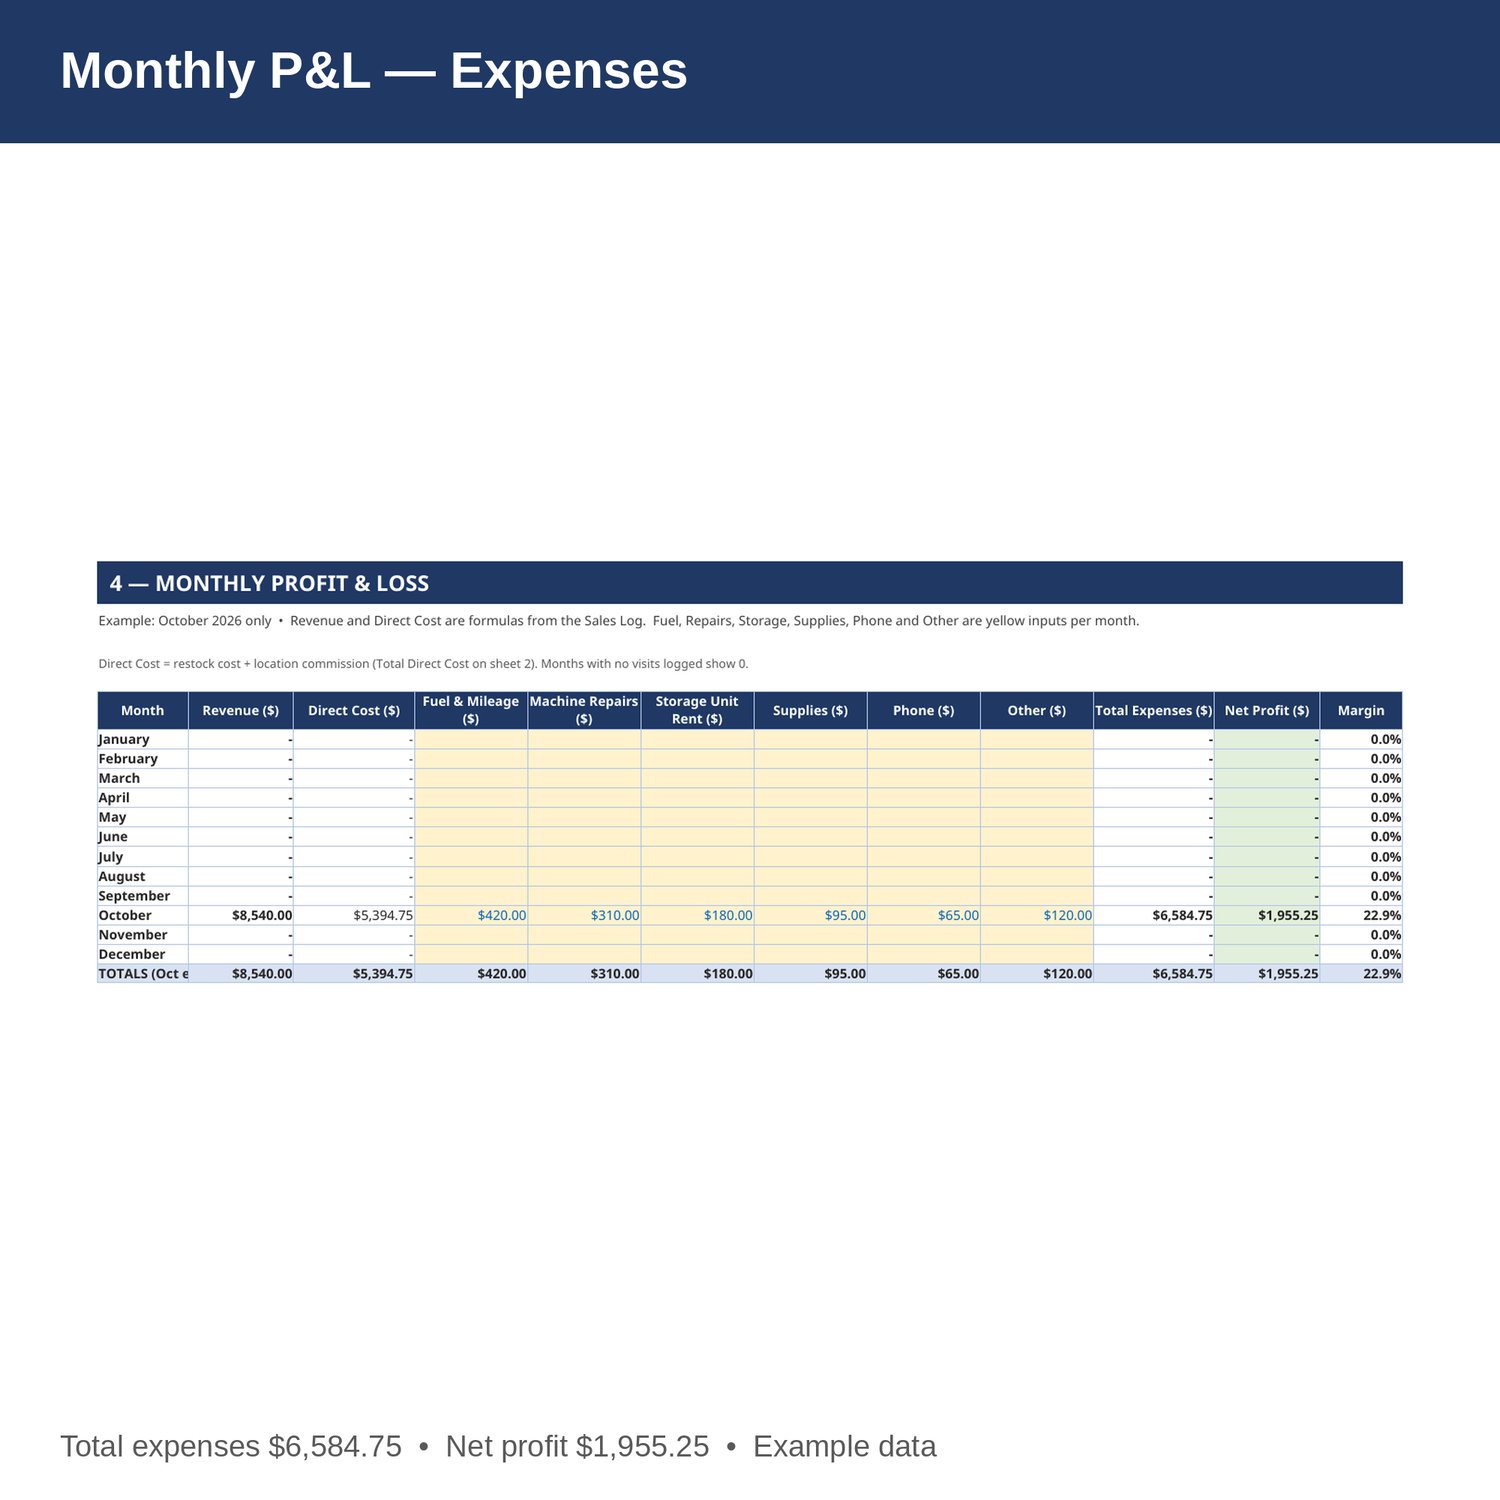
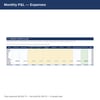
- Monthly P and L — revenue, direct cost (restock plus commission), fuel, repairs, storage rent, supplies, phone and other expenses by month, Jan-Dec, with net profit and margin. Revenue and direct cost are formulas from the Sales Log.
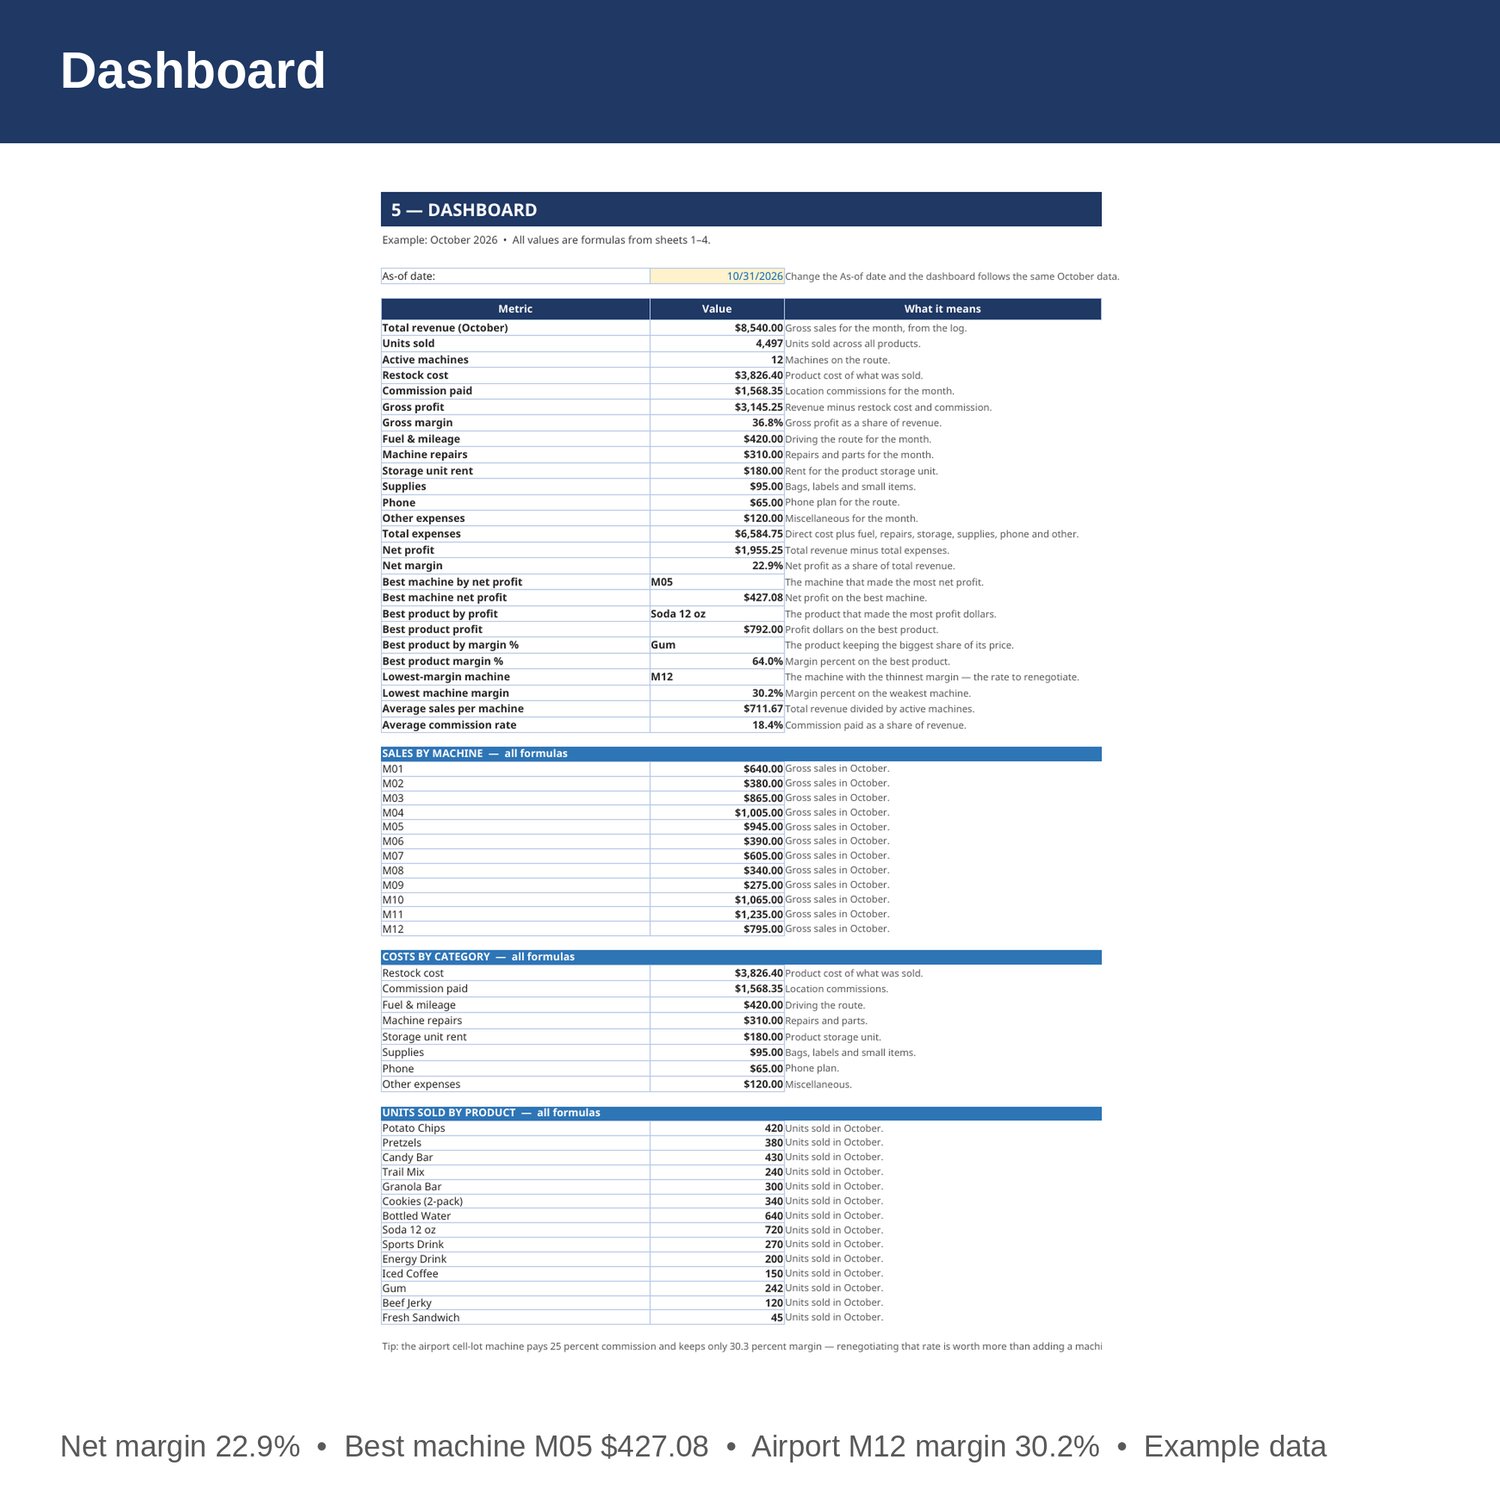
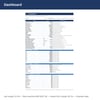
- Dashboard — total revenue, units sold, machines, restock cost, commission, gross and net profit and margin, best machine and best product, lowest-margin machine, average sales per machine, average commission rate, sales by machine, costs by category, and units sold by product.
- Cover and How to Use — start here. Yellow cells are the only ones you edit.
EXAMPLE DATA (October 2026 — replace with your own numbers):
- Total revenue (gross sales) 8,540 from 20 restock visits; 4,497 units sold; average sales per machine 711.67.
- Restock cost 3,826.40; commission paid 1,568.35; total direct cost 5,394.75; gross profit 3,145.25; gross margin 36.8 percent; average commission rate 18.4 percent.
- Fuel and mileage 420, machine repairs 310, storage unit rent 180, supplies 95, phone 65, other 120; total expenses 6,584.75; net profit 1,955.25; net margin 22.9 percent.
- Best machine by net profit: M05 (ASU Polytechnic Combo), 427.08. Lowest-margin machine: M12 (Phoenix Airport Cell Lot), 30.2 percent at a 25 percent commission rate.
- Best product by profit: Soda 12 oz, 792. Best product by margin percent: Gum, 64.0 percent. Worst product by margin percent: Fresh Sandwich, 25.5 percent.
- Product revenue 8,540 — the same as gross sales on the log; product profit 4,713.60 before commission.
HOW IT WORKS:
1. Download the Excel file instantly after purchase.
2. On sheet 1, enter each machine, its location, type, and commission rate. Sales, restock cost, commission and net profit fill in from the log.
3. On sheet 2, add a row per restock visit: date, machine (spelled exactly as on sheet 1), location, gross sales, and restock cost. Commission and net profit fill in by formula.
4. On sheet 3, enter each product's price, cost, units sold, and machines stocked. Revenue, profit and margin fill in by formula.
5. On sheet 4, enter fuel, repairs, storage rent, supplies, phone and other expenses each month, then check gross and net profit on the Dashboard.
HOW THE NUMBERS WORK:
Commission paid is gross sales times the machine's commission rate from sheet 1. Net profit per machine is gross sales minus restock cost minus commission. Gross profit is revenue minus restock cost and commission; net profit is revenue minus direct cost, fuel, repairs, storage rent, supplies, phone, and other expenses. Product profit is revenue minus units sold times cost — before location commission, which is charged on the machine, not the product.
WHO IT'S FOR:
Vending route operators, snack and drink machine owners, and anyone buying or running a vending route who wants machines, locations, commissions, product margins, and a monthly P and L in one workbook — without accounting software.
PLEASE NOTE:
- This is a digital download. No physical item will be shipped.
- Works in Microsoft Excel and Google Sheets (upload to Google Drive to open in Sheets).
- Example data for October 2026 is included (12 machines, 6 locations, 20 restock visits, 14 products, 4,497 units sold). Replace it with your own numbers.
- The example is simplified: it has no machine depreciation and no owner labor costed — add those lines on the P and L if they apply to your route. Spoilage is not costed separately; the Fresh Sandwich margin already reflects its thin price-to-cost gap.
- This is a bookkeeping and planning tool only, not tax, legal, or CPA advice.
- Due to the nature of digital downloads, refunds are not available. Message me before buying if you have a question.
Built by an accountant: B.S. Accountancy, ASU W. P. Carey, with revenue-reconciliation experience at Marriott and audit work at PwC.