


Inducement and Sweep ICT Indicator for MT4 Download – Free – [TradingFinder]
The Market Structure and Liquidity Hunt (MSIS) in MT4 indicator 🧠 is an advanced analytical tool developed for MetaTrader 4 (MT4), designed to help traders visualize how institutional players move the market. By identifying critical elements such as Change of Character (CHoCH), Break of Structure (BOS), Inducement (IDM), and Liquidity Zones, this indicator delivers a complete map of market behavior — revealing how liquidity is trapped and released. 💰
📊 MSIS Indicator Specifications
📂 Categories:
ICT MT4 Indicators
Smart Money MT4 Indicators
Liquidity MT4 Indicators
🖥️ Platform: MetaTrader 4
🎯 Skill Level: Advanced
⚙️ Type: Reversal Indicator
⏱️ Timeframe: Multi-Timeframe
💼 Style: Scalping | Day Trading
🌍 Markets: Forex | Crypto | Stocks | Commodities | Indices
💡 Overview of the MSIS Indicator
The MSIS Indicator reveals the hidden story of price movement by marking structural changes and liquidity traps automatically. It detects where liquidity inducement occurs — areas where the market tempts traders into premature entries before reversing.
This makes it a powerful ally for traders who follow ICT and Smart Money Concepts, offering a clear, visual representation of where big players collect liquidity and where the next move might begin. 🔍
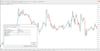
📈 Uptrend Example
On the USD/MXN daily chart, after a Change of Character (CHoCH), the MSIS indicator begins to highlight each Break of Structure (BOS) as the market builds higher highs and higher lows.
🟢 Insights:
- CHoCH confirms a shift from bearish to bullish direction.
- BOS indicates structure continuation.
- Liquidity zones mark institutional accumulation points.
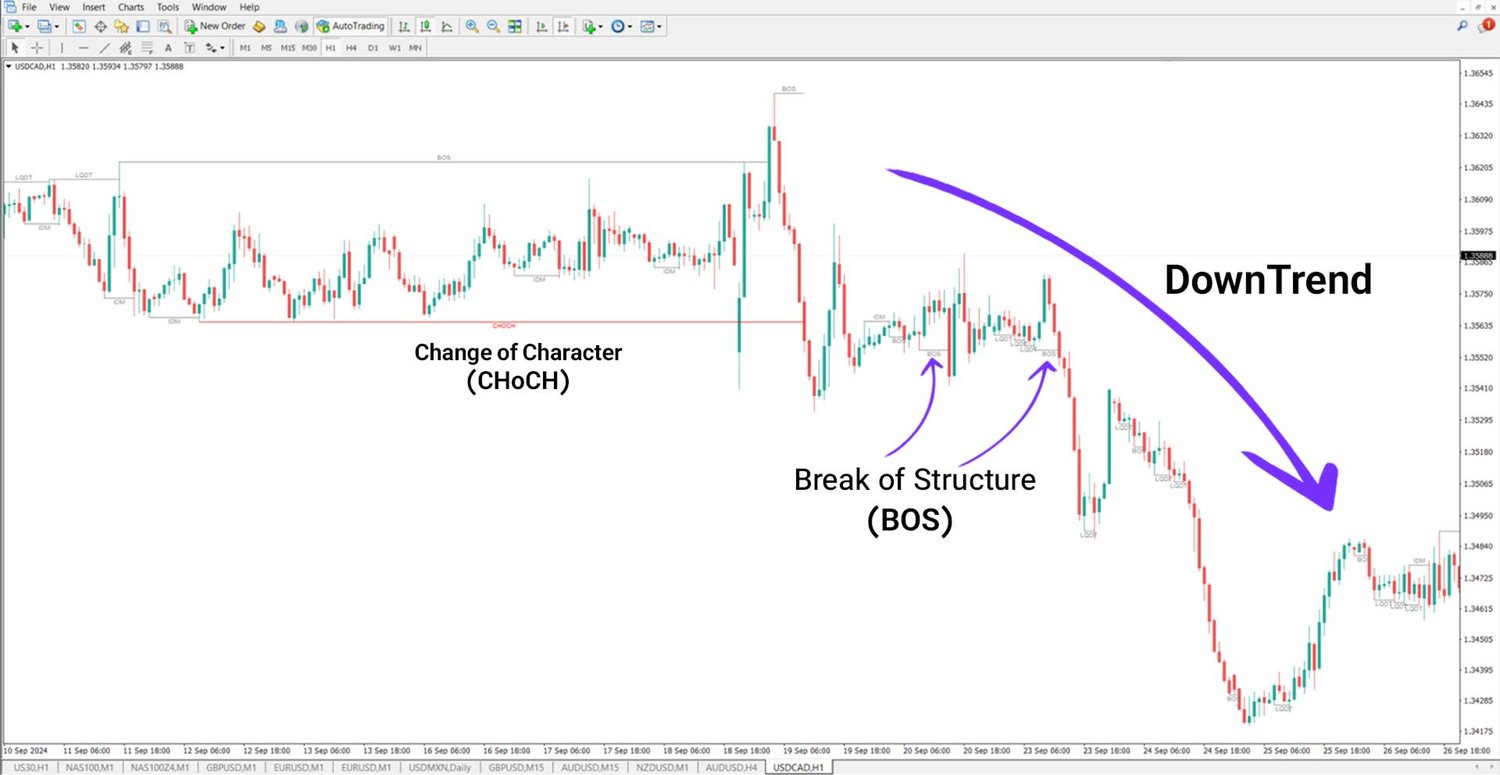
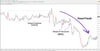
📉 Downtrend Example
In the USD/CAD 1-hour chart, a Change of Character (CHoCH) marks the start of a downtrend.
The MSIS then automatically detects each Break of Structure (BOS) and highlights Inducement Zones, showing where liquidity traps occur before price continues downward.
🔴 Insights:
- CHoCH signals a transition to bearish structure.
- BOS validates lower lows formation.
- Inducement areas expose liquidity sweeps before continuation.
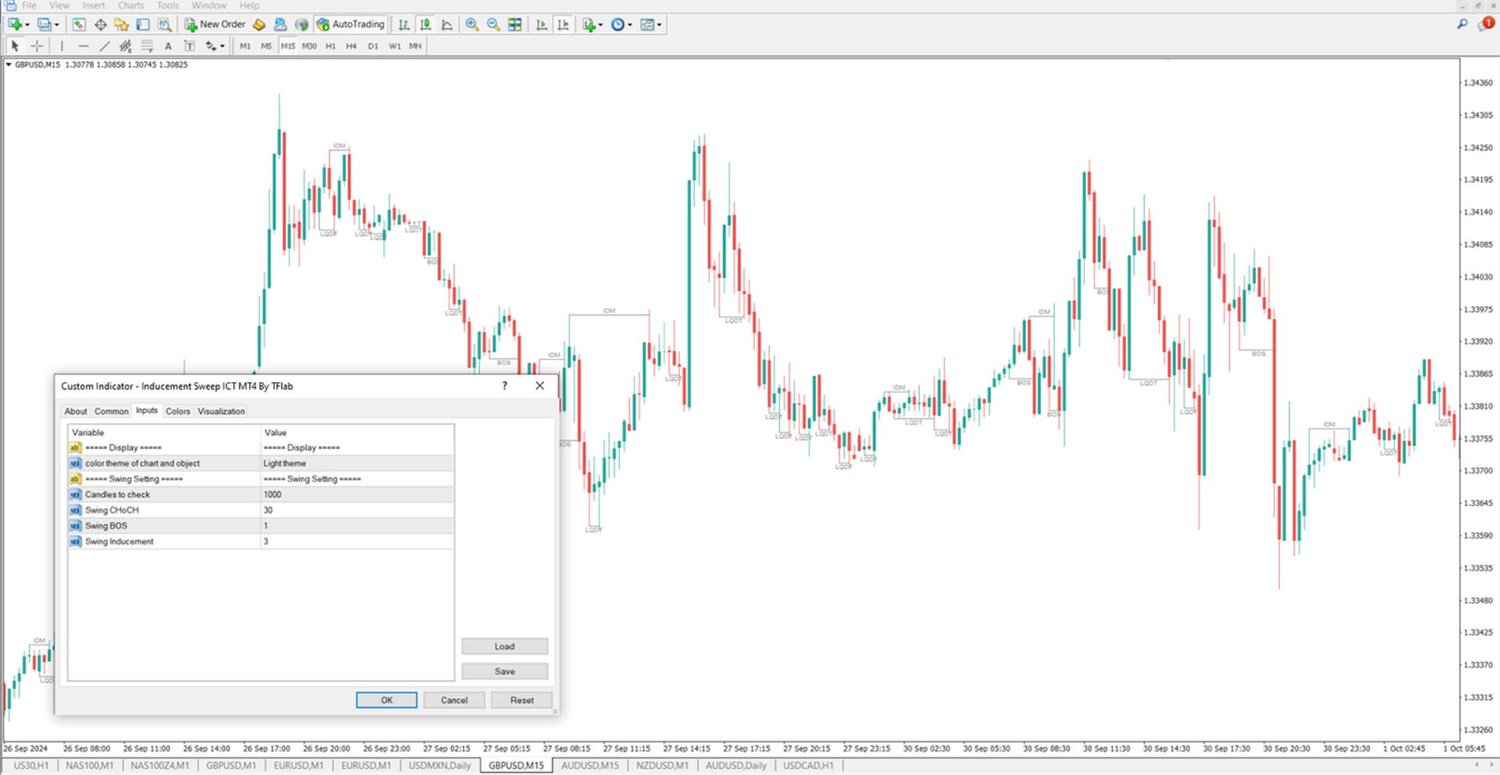
⚙️ Settings Overview
- 🎨 Chart Theme: Customize colors for clarity.
- 🕯️ Candles to Check: Number of bars analyzed for structure.
- 🔁 Swing CHoCH: Defines Change of Character sensitivity.
- 📉 Swing BOS: Adjust Break of Structure detection.
- ⚡ Swing Inducement: Determines inducement calculation precision.
✨ Conclusion
The Market Structure & Liquidity Hunt (MSIS) indicator gives traders a professional edge by visualizing how Smart Money manipulates price through structural shifts and liquidity sweeps.
By combining CHoCH, BOS, IDM, and Liquidity Zone detection, it transforms raw chart data into actionable insights — empowering traders to enter the market with precision, confidence, and institutional clarity. 🦅