

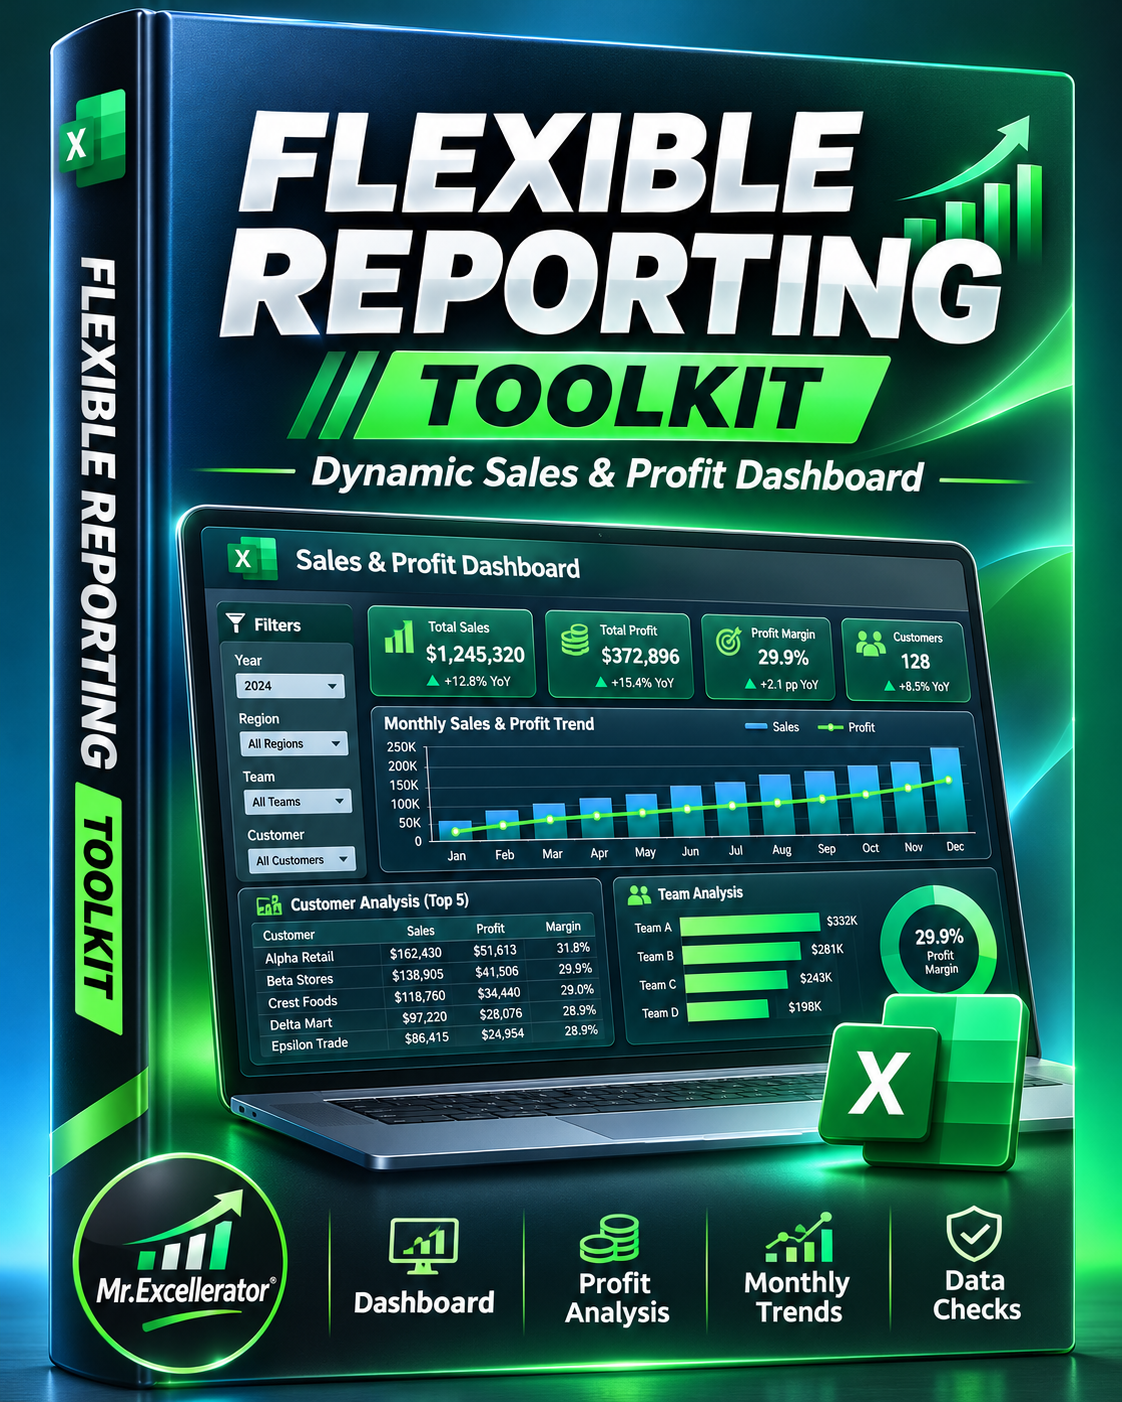
Excel Flexible Reporting Toolkit — Dynamic Sales & Profit Dashboard
Excel Flexible Reporting Toolkit — Dynamic Sales & Profit Dashboard
Turn growing Excel data into clear, reusable business reports — without rebuilding your formulas every time new records arrive.
Tired of manually extending formulas, updating report ranges, and rebuilding summaries whenever your business data changes?
The Excel Flexible Reporting Toolkit is a ready-to-use reporting system designed to help you organize transactions, monitor financial performance, analyze customers, and track business trends in one structured Excel workbook.
Built around Excel Tables, dynamic named ranges, and reusable reporting formulas, this toolkit helps your reports grow alongside your data.
What's Inside
1. Structured Transaction Management
- Organized transaction input table
- Expandable data structure for additional records
- Consistent fields for easier reporting
- Dynamic references connected to the reporting system
2. Interactive Business Dashboard
- Revenue and profit indicators
- Team and status selections
- Automatically calculated performance metrics
- Clear summaries for faster business decisions
3. Customer Profitability Analysis
- Compare customer revenue and profitability
- Identify higher-value customer relationships
- Review customer-level performance
- Support more informed business decisions
4. Monthly Performance Tracking
- Analyze results across reporting periods
- Compare revenue and profit trends
- Visualize monthly performance
- Spot changes in business activity
5. Data Quality & Reconciliation
- Review common data quality issues
- Check reporting consistency
- Identify records that may require attention
- Support more reliable financial summaries
Why This Toolkit Is Different
A simple Excel tutorial teaches you a formula.
This toolkit gives you a reusable reporting workflow built around that formula.
Instead of copying fixed cell ranges into every report, you can work with structured source data and formulas designed to accommodate new records.
Who Is It For?
- Business and financial analysts
- Sales and operations managers
- Small business owners
- Excel users who maintain recurring reports
- Professionals working with growing transaction datasets
How to Get Started
- Open the workbook in Excel.
- Review the included instructions and sample data.
- Explore the dashboard and reporting sections.
- Enter your own transactions using the existing table structure.
- Review the updated calculations, summaries, and data checks.
Workbook Features
- 8 organized Excel worksheets
- Expandable Excel Tables
- Dynamic named ranges
- Formula-driven business KPIs
- Team and status reporting
- Customer profitability analysis
- Monthly reporting
- Data quality checks
- Built for Excel 2021-compatible formulas
Stop rebuilding reports. Start working with a reporting system designed to grow with your data.
Digital download: Excel workbook (.xlsx). Microsoft Excel recommended.