
PERSONAL PROTECTIVE EQUIPMENT (PPE) MONITORING DASHBOARD
🧩 Personal Protective Equipment (PPE) Monitoring Dashboard 03
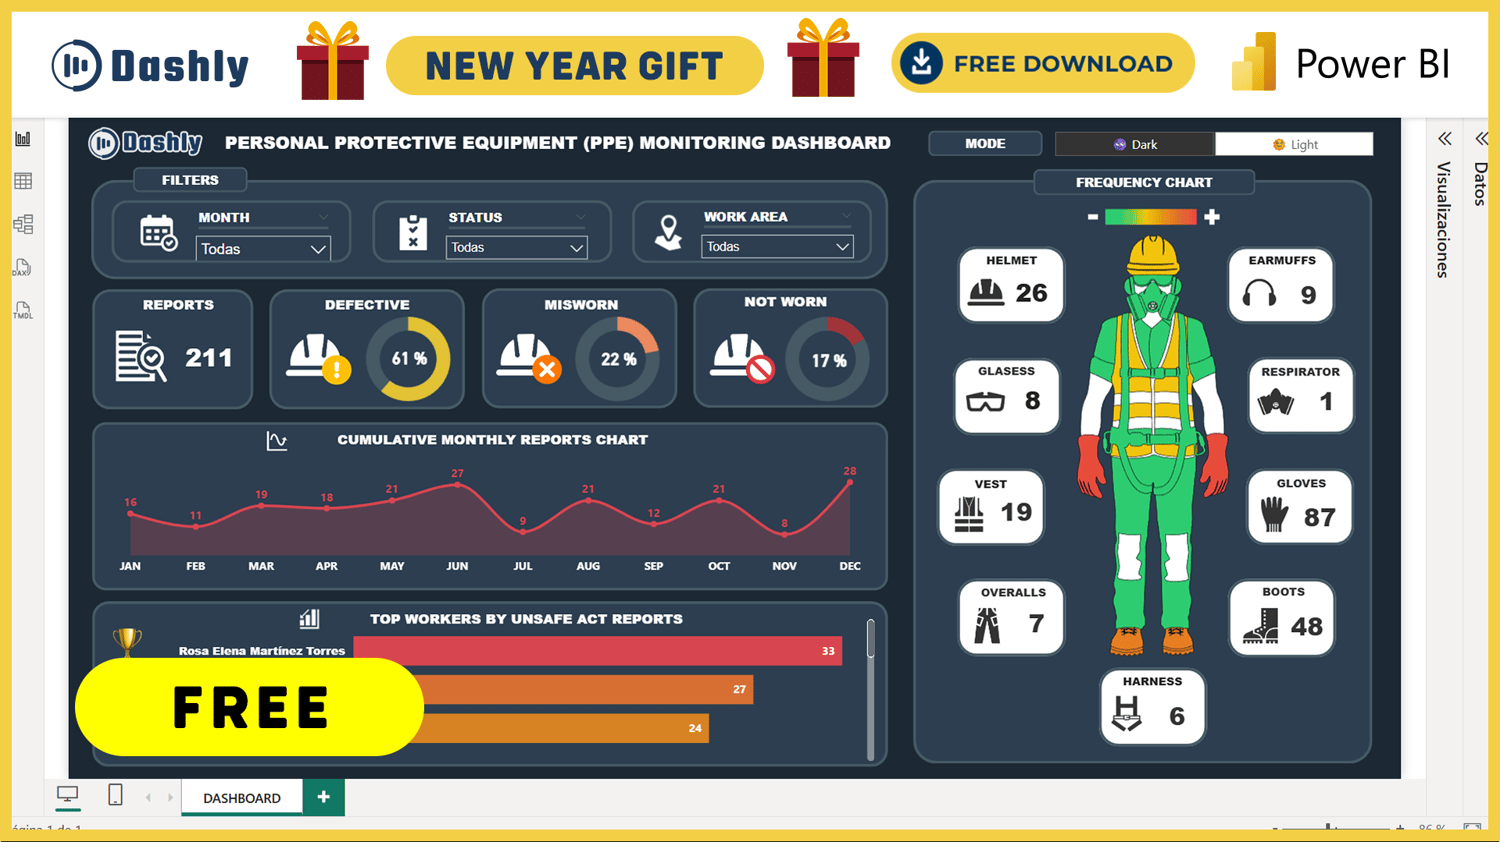
Optimize the management and control of PPE usage in your organization with this interactive Power BI dashboard, designed for Occupational Health and Safety supervisors and engineers.
Analyze data clearly, quickly, and visually to support better preventive decision-making.
📊 Key Features
- Dynamic filters by month, PPE type, status (defective, improperly worn, not used), and area or zone.
- Monthly cumulative reports chart.
- Worker ranking with the highest number of observations (Unsafe Behavior Ranking).
- PPE reports by area and status with comparative charts.
- Frequency heat map showing each worker and their assigned PPE, color-coded from white to red based on the number of reports.
⚙️ Benefits
✅ Centralizes all PPE information in a single dashboard.
✅ Identifies critical areas and high-risk workers.
✅ Enables visual monitoring and faster decision-making.
✅ Built in Power BI — no external tools required.