



Auto Repair Shop Profit Tracker
Auto Repair Shop Profit Tracker Excel with repair jobs, parts markup, labor rate and techs, monthly P and L, and a dashboard with bay utilization. Know what every job actually made — after parts, labor, and overhead.
Built for independent repair shops and mechanics who need to know, job by job, whether the price covers the parts and the labor — without accounting software. If a job is losing money, this workbook shows you while there is still time to fix the price or the markup.
WHAT'S INCLUDED (6 sheets):
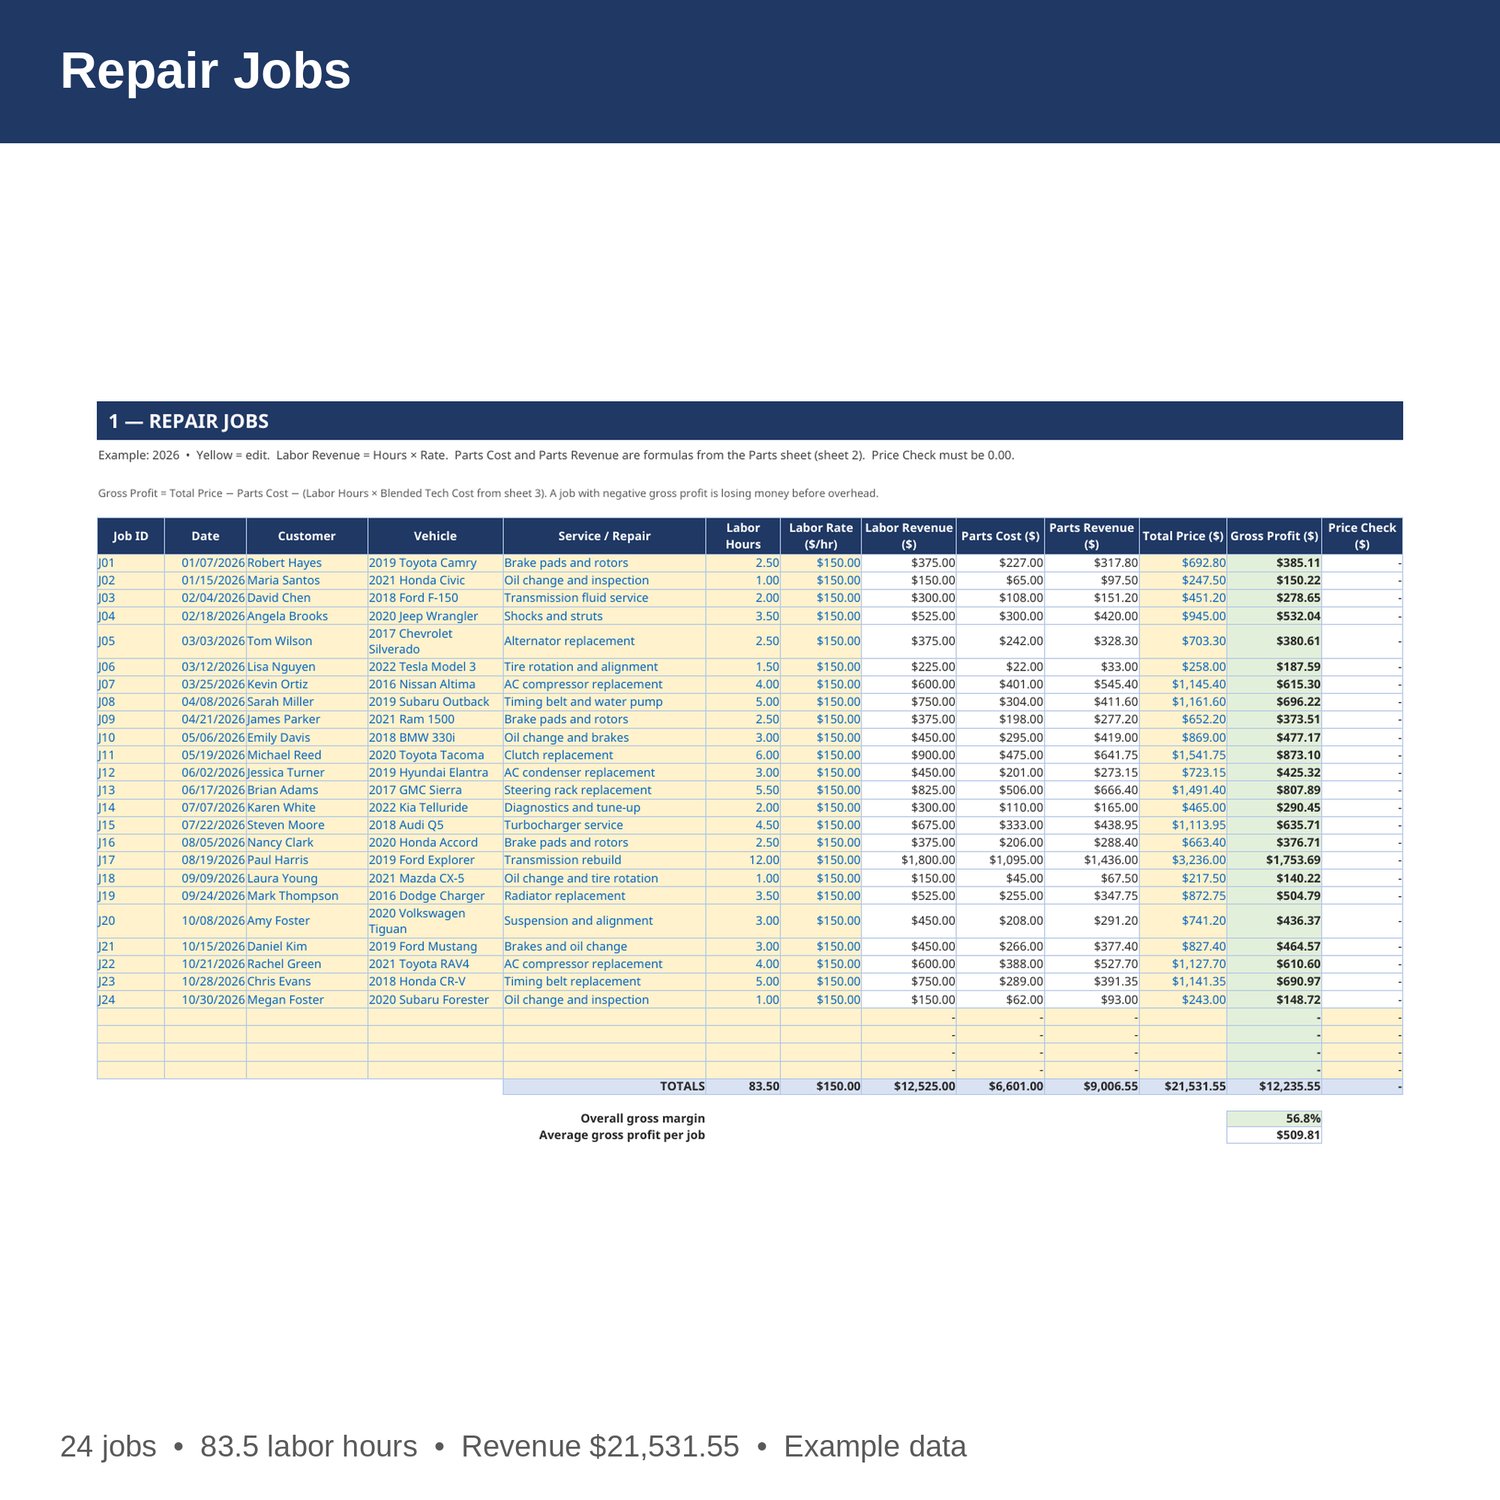
- Repair Jobs — every job: date, customer, vehicle, service, labor hours, labor rate, labor revenue, parts cost and parts revenue pulled from the Parts sheet, total price, and gross profit. A price check flags any job where the price does not match labor plus parts.
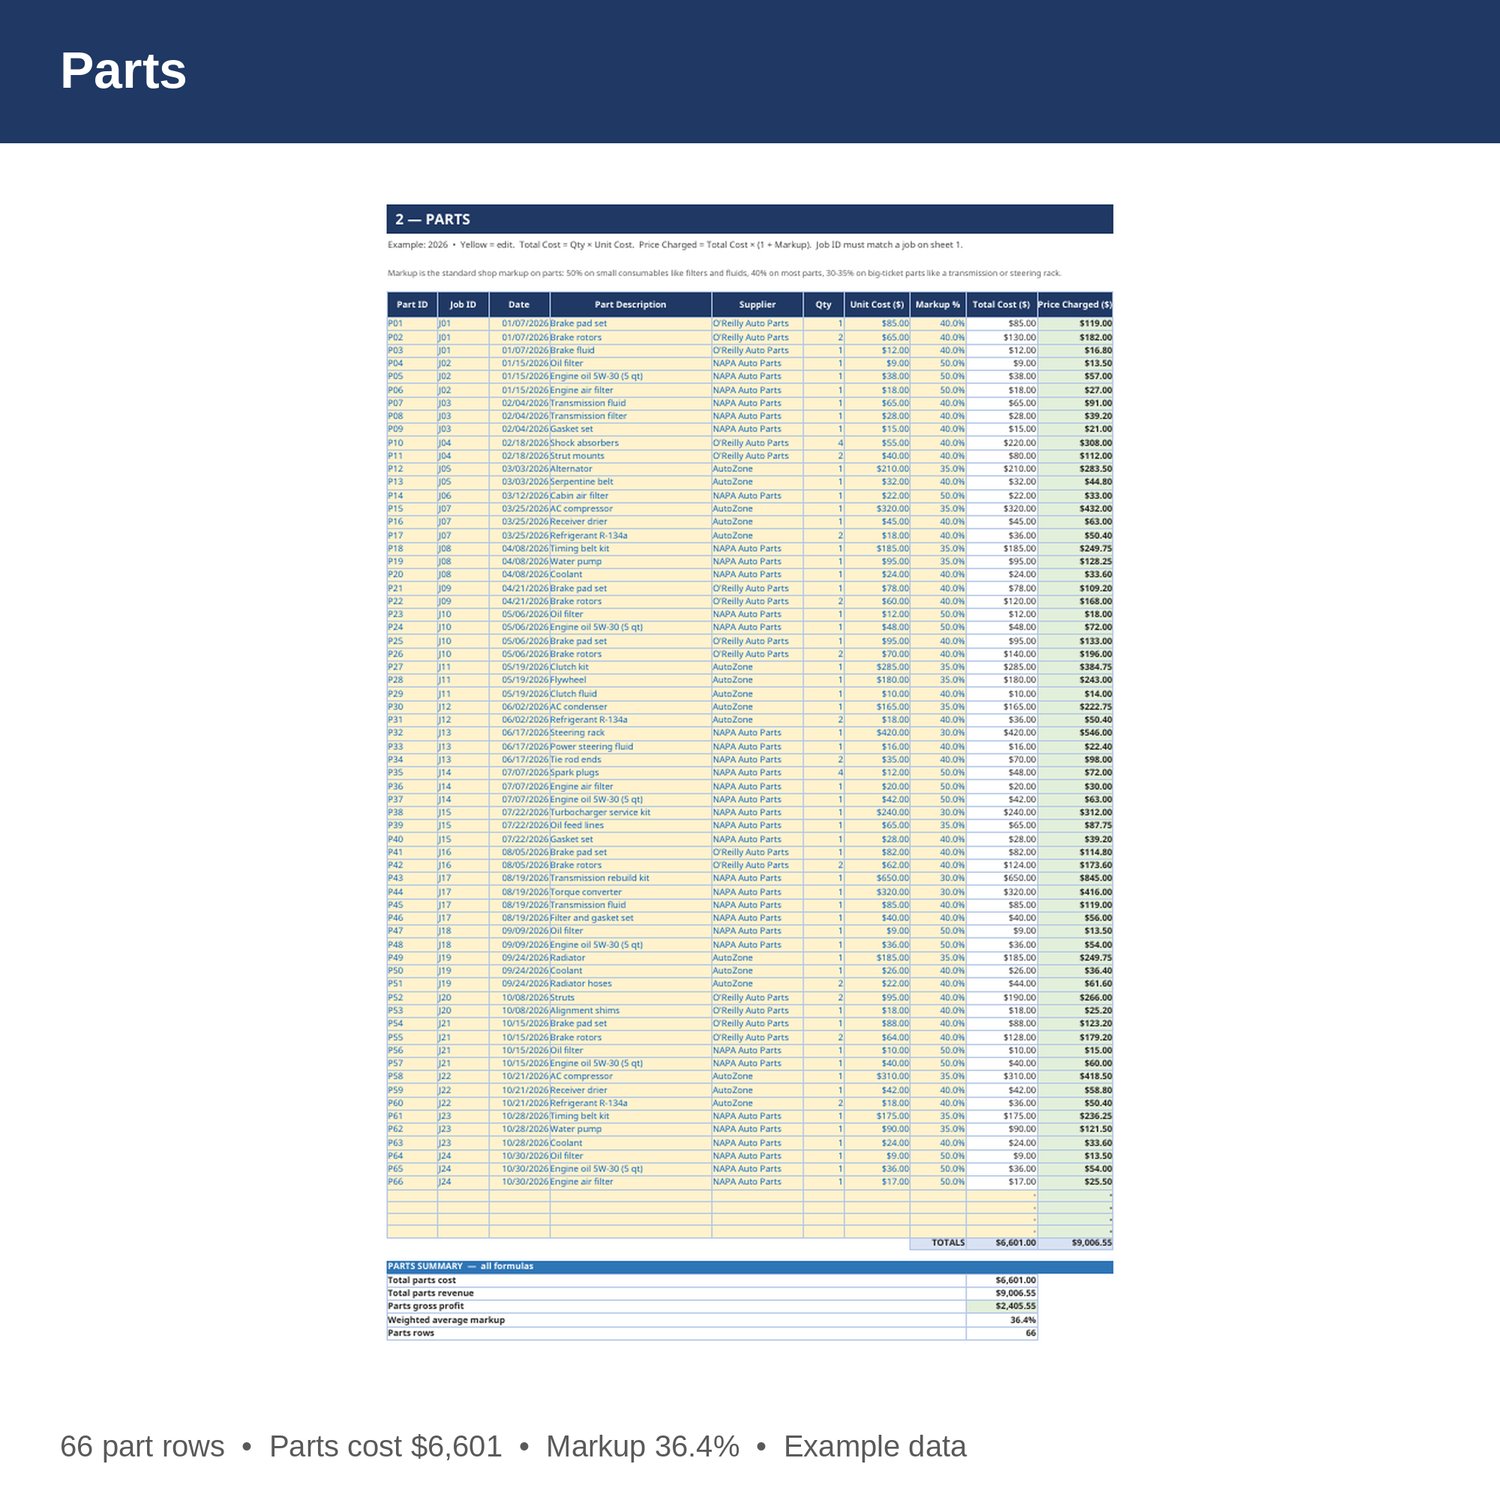
- Parts — every part, tied to a job: supplier, quantity, unit cost, and markup. Total cost and price charged calculate automatically. This is the master parts record — the Jobs sheet, P and L, and Dashboard all read from it, so nothing is counted twice.
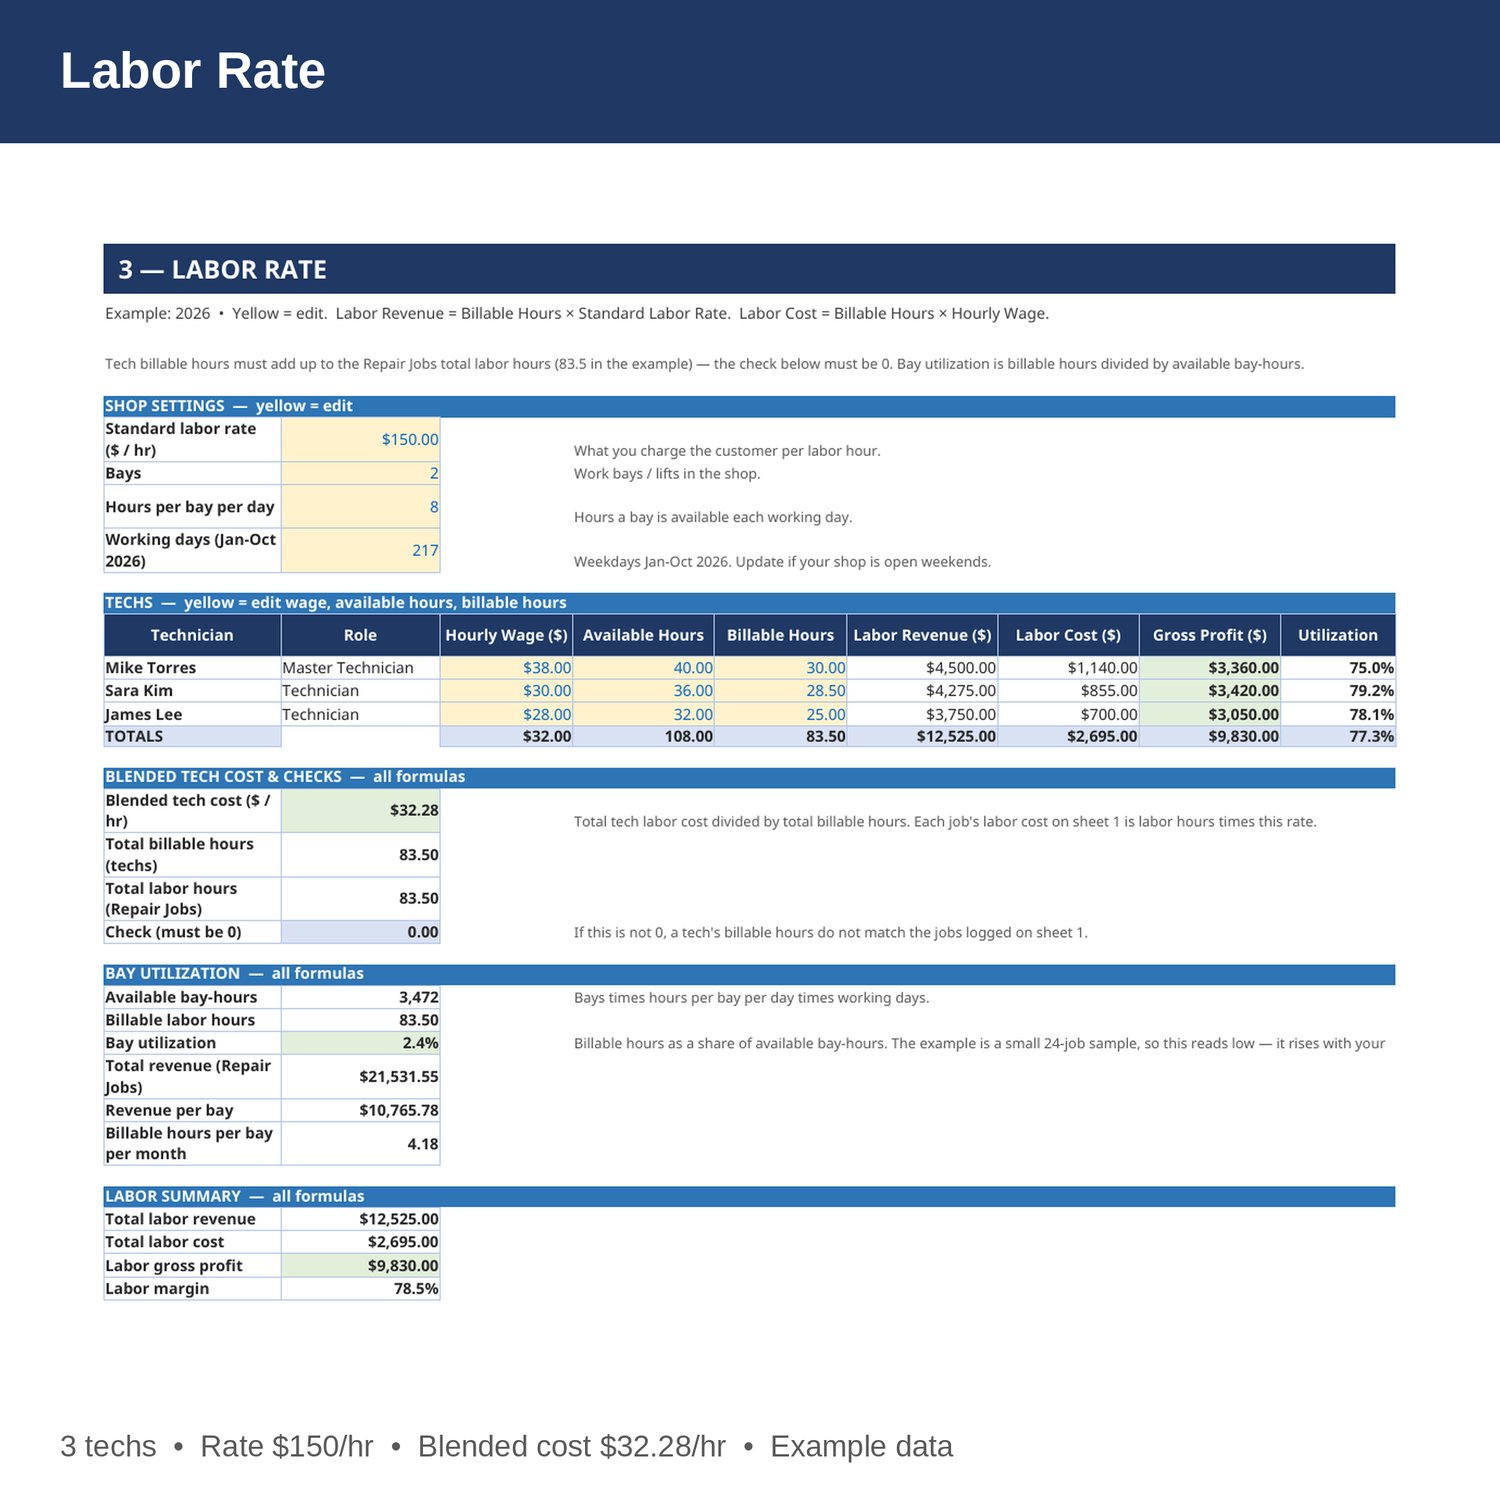
- Labor Rate — your techs: hourly wage, available hours, and billable hours, with labor revenue, labor cost, gross profit, and utilization per tech. Also your shop rate, bays, blended tech cost, and bay utilization.
- Monthly P and L — per month: jobs, labor hours, revenue, parts cost, labor cost, overhead, net profit, margin, and revenue per job. Monthly overhead is editable at the top of the sheet.
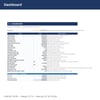
- Dashboard — total revenue, total costs, total profit and margin, profit per job, best and worst jobs, parts markup, labor margin, and bay utilization.
- Cover and How to Use — start here. Yellow cells are the only ones you edit.
EXAMPLE DATA (2026, 24 jobs, Jan-Oct — replace with your own numbers):
- Total revenue 21,531.55: labor revenue 12,525 (83.5 hours at 150 per hour), parts revenue 9,006.55.
- Total costs 18,796: parts cost 6,601, labor cost 2,695, overhead 9,500 (950 per month). Total profit 2,735.55; margin 12.7 percent.
- Average price per job 897.15; average gross profit per job 509.81; average net profit per job 113.98.
- Parts gross profit 2,405.55 at a weighted average markup of 36.4 percent. Labor gross profit 9,830; labor margin 78.5 percent; blended tech cost 32.28 per hour.
- Best job: J17, 2019 Ford Explorer transmission rebuild, profit 1,753.69. Worst job: J18, 2021 Mazda CX-5 oil change and tire rotation, profit 140.22.
- Best month: October, profit 1,401.24 (5 jobs). Worst month: September, minus 304.99 (2 jobs). January and February are also negative in the example because 950 of monthly overhead outweighs 2 small jobs — the sheet shows slow months honestly.
- Bay utilization 2.4 percent in the example. The example is a small 24-job sample, so this reads low — it rises with your own volume. Revenue per bay 10,765.78.
HOW IT WORKS:
1. Download the Excel file instantly after purchase.
2. On sheet 3, enter your standard labor rate, your bays, and each tech's wage and available hours.
3. Add a row on sheet 1 for every job: date, customer, vehicle, service, labor hours, labor rate, and total price.
4. Log every part on sheet 2 with the right Job ID, quantity, unit cost, and markup. A job's profit is only right if its parts are logged.
5. Check the Price Check column on sheet 1 — it must be 0.00. If it is not zero, a part or the labor rate is wrong.
HOW THE MONEY WORKS:
Gross profit per job is total price minus parts cost minus labor hours times the blended tech cost (total tech wages divided by total billable hours, from sheet 3). Total profit is total revenue minus parts cost, labor cost, and overhead. Bay utilization is billable hours divided by available bay-hours (bays times hours per bay per day times working days) — low utilization means the bays are sitting empty.
WHO IT'S FOR:
Independent repair shops, mobile mechanics, and small garages who want clean per-job books, parts markup they can trust, and a profit number per job before they quote the next one.
PLEASE NOTE:
- This is a digital download. No physical item will be shipped.
- Works in Microsoft Excel and Google Sheets (upload to Google Drive to open in Sheets).
- Example data for 2026 is included (24 jobs, 66 part rows, Jan-Oct). Replace it with your own numbers.
- This is a bookkeeping and planning tool only, not tax, legal, or CPA advice. Confirm tax and legal decisions with your own accountant or CPA.
- Due to the nature of digital downloads, refunds are not available. Message me before buying if you have a question.
Built by an accountant: B.S. Accountancy, ASU W. P. Carey, with revenue-reconciliation experience at Marriott and audit work at PwC.