

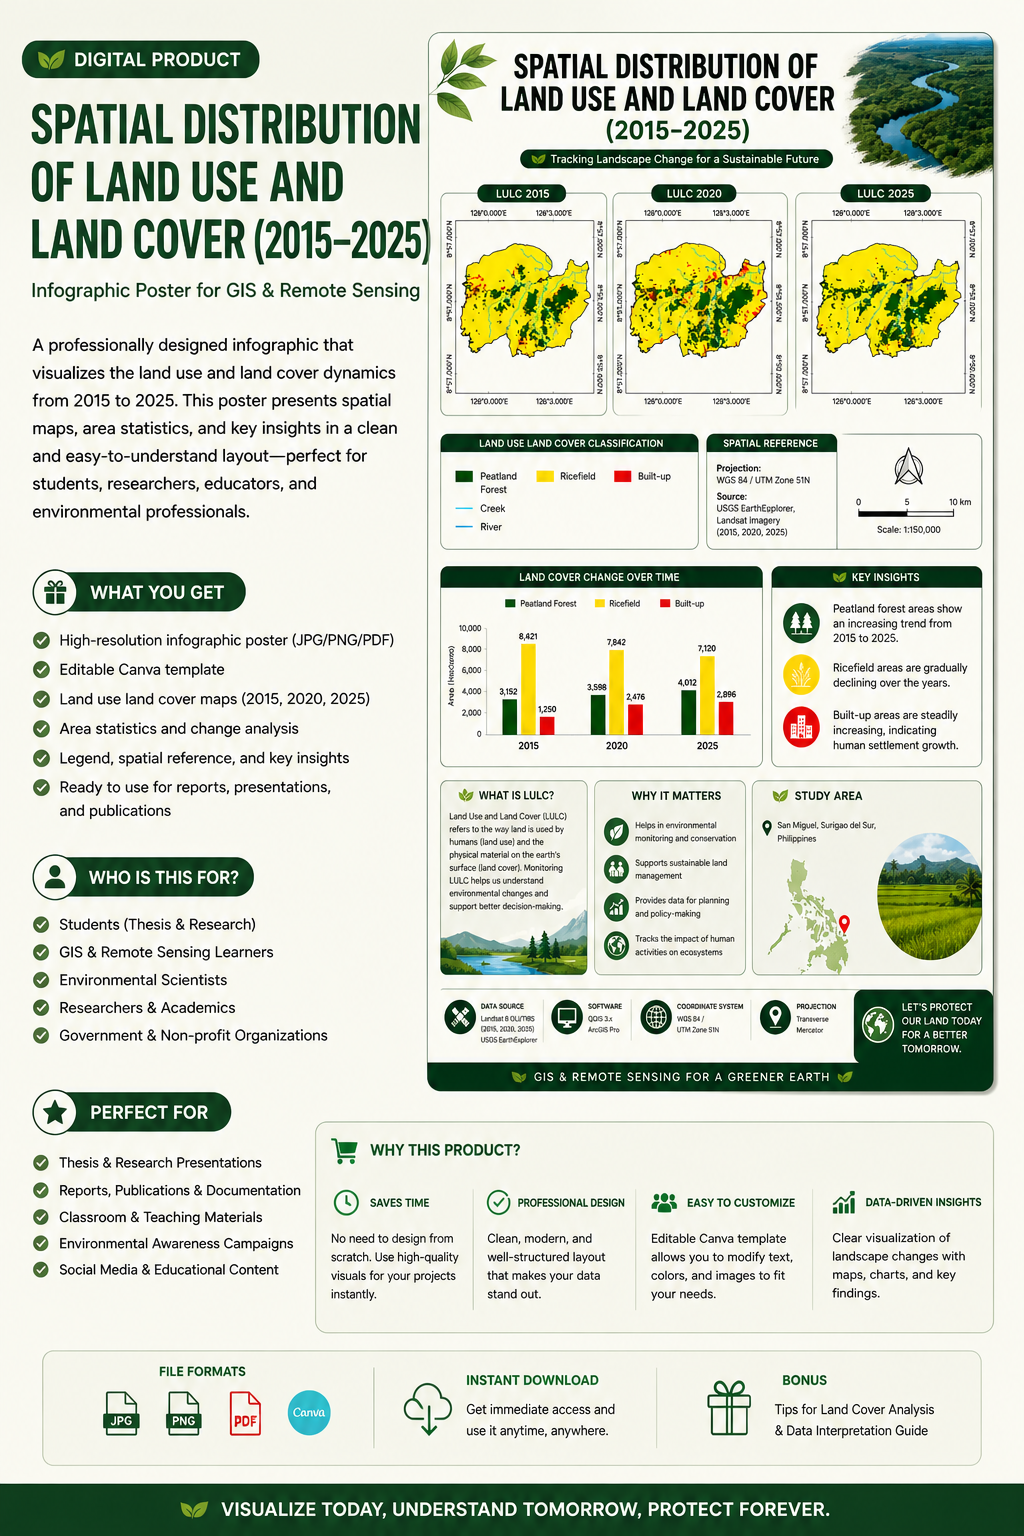
Spatial Distribution of Land Use and Land Cover (2015–2025) Infographic Poster for GIS & Remote Sensing Analysis
Turn complex spatial data into a powerful visual story.
This professionally designed infographic poster presents a clear and comprehensive analysis of Land Use and Land Cover (LULC) changes from 2015 to 2025. Using GIS and remote sensing data, the poster highlights how landscapes evolve over time—showing the distribution of peatland forests, rice fields, and built-up areas.
Designed for both academic and professional use, this infographic simplifies technical outputs into an easy-to-understand format. It combines maps, classification legends, area statistics, and key insights into a clean and visually appealing layout—making it perfect for presentations, reports, and educational materials.
Whether you are a student, researcher, or environmental professional, this product helps you communicate spatial data effectively without spending hours on design.
📦 WHAT YOU WILL GET
✔ High-resolution infographic poster (PNG, JPG, PDF)
✔ Land Use and Land Cover maps (2015, 2020, 2025)
✔ Clean LULC classification legend
✔ Land cover change analysis (area comparison)
✔ Key insights and interpretation
✔ Ready-to-use presentation design
WHO IS THIS FOR?
✔ Students (Thesis, Capstone, Research)
✔ GIS & Remote Sensing learners
✔ Environmental Science and Forestry students
✔ Researchers and academicians
✔ Government and environmental organizations
WHY THIS PRODUCT IS VALUABLE
• Converts raw GIS outputs into a professional infographic
• Saves time in designing research visuals
• Enhances clarity in data presentation
• Helps explain land cover changes easily
• Can be reused as a template for similar studies
PERFECT FOR
✔ Thesis and dissertation presentations
✔ Research reports and publications
✔ Classroom teaching materials
✔ Environmental awareness campaigns
✔ Social media educational content
SHORT SOCIAL MEDIA CAPTION
🌍 How has land use changed over the last decade?
This LULC infographic reveals the transformation of landscapes from 2015 to 2025 using GIS and satellite data 🛰️
Perfect for students, researchers, and environmental professionals.
📥 Download now and upgrade your research visuals!
Just contact me via email: ecoresearchhub27@gmail.com
✔ (Optional) Editable Canva version for customization