6th Grade Math - Understanding Dot Plots 1 (Standard 6.NR.2)
On Sale
$8.00
$8.00
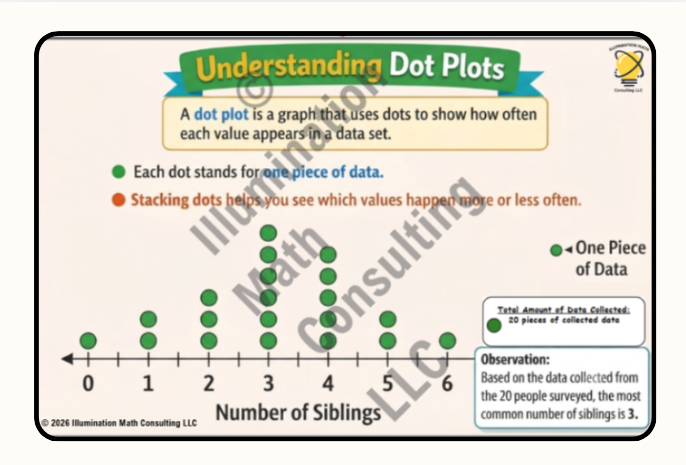
- Help your students visualize data with this bright, easy‑to‑read dot plot anchor chart!
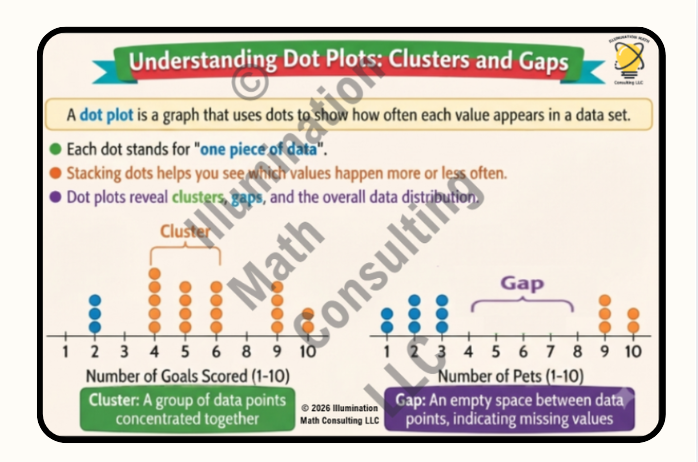
- This resource clearly explains what a dot plot is, how each dot represents one piece of data, and how stacked dots show frequency.
- Students learn to make observations from real data and interpret patterns at a glance.
- Perfect for introducing or reviewing data representation, frequency, and basic statistical thinking in any math classroom.
- Learning Objective 6.NR.2.2
Single‑Teacher License: You may use this resource with your own students only. Sharing the PDF or Google Slides with other teachers, schools, or public sites is not permitted.
© 2026 Illumination Math Consulting LLC. For classroom use only. Not for resale or redistribution.