


The Three Methods Explained — Measured (PDF Guide)
You will be shown a number like "this pattern gains five points over a random entry" and you have no way to judge it. Five points sounds like a lot. Whether it is a discovery or an accident depends entirely on something almost nobody prints next to it, and this guide is built around the cleanest example of that in either wave.
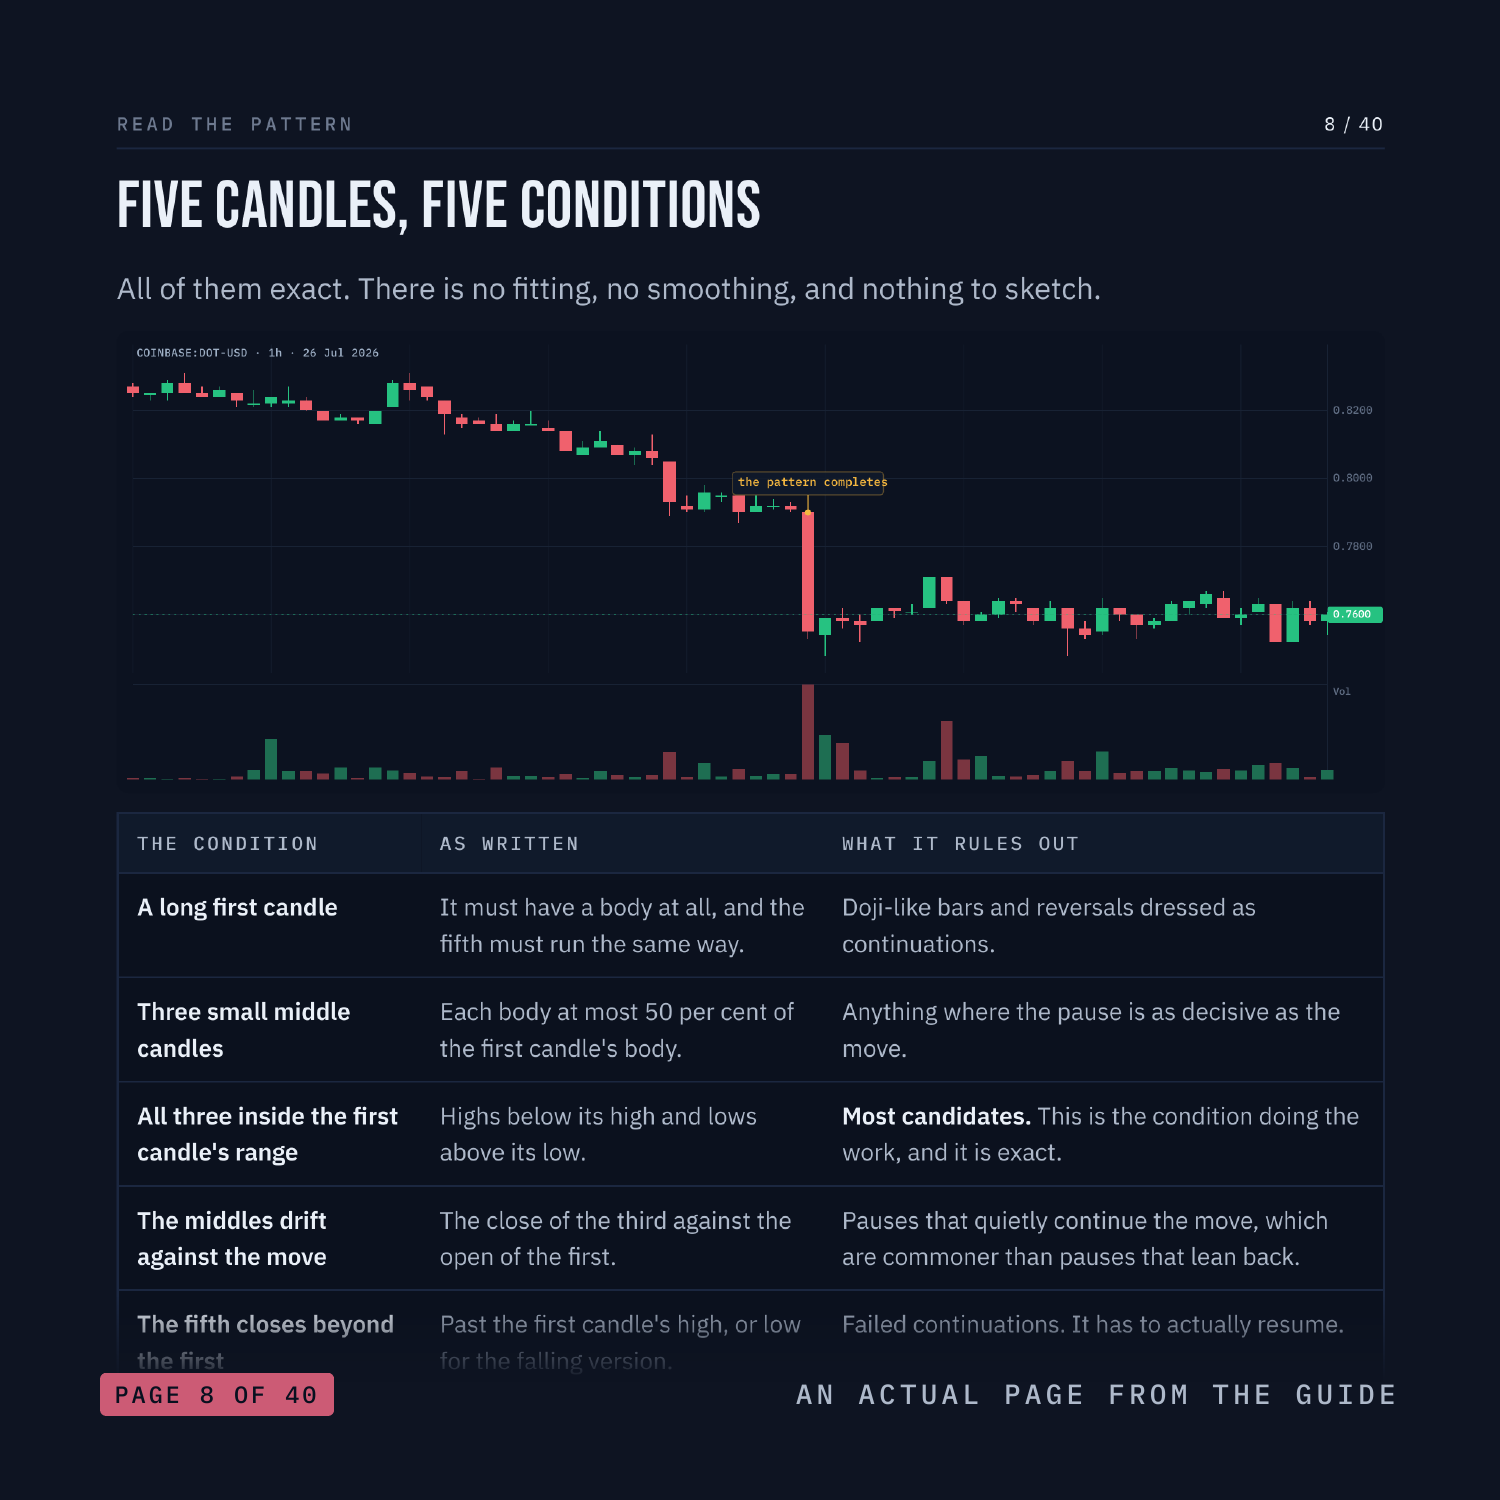
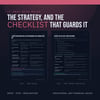
The three methods is a candlestick pattern: five candles, read straight off the bars. No smoothing, no bandwidth, so the counts are exact - the only exact counts in this wave. Across 35,944 bars it appears 13 times rising and 31 times falling, which makes it the rarest shape measured here by an order of magnitude. Everything in this guide follows from what a sample that small can and cannot tell you. This is a 40-page PDF that teaches The Three Methods from the first thing you see on the screen through to a written strategy with an entry, a stop and an explicit rule for when the trade is wrong.
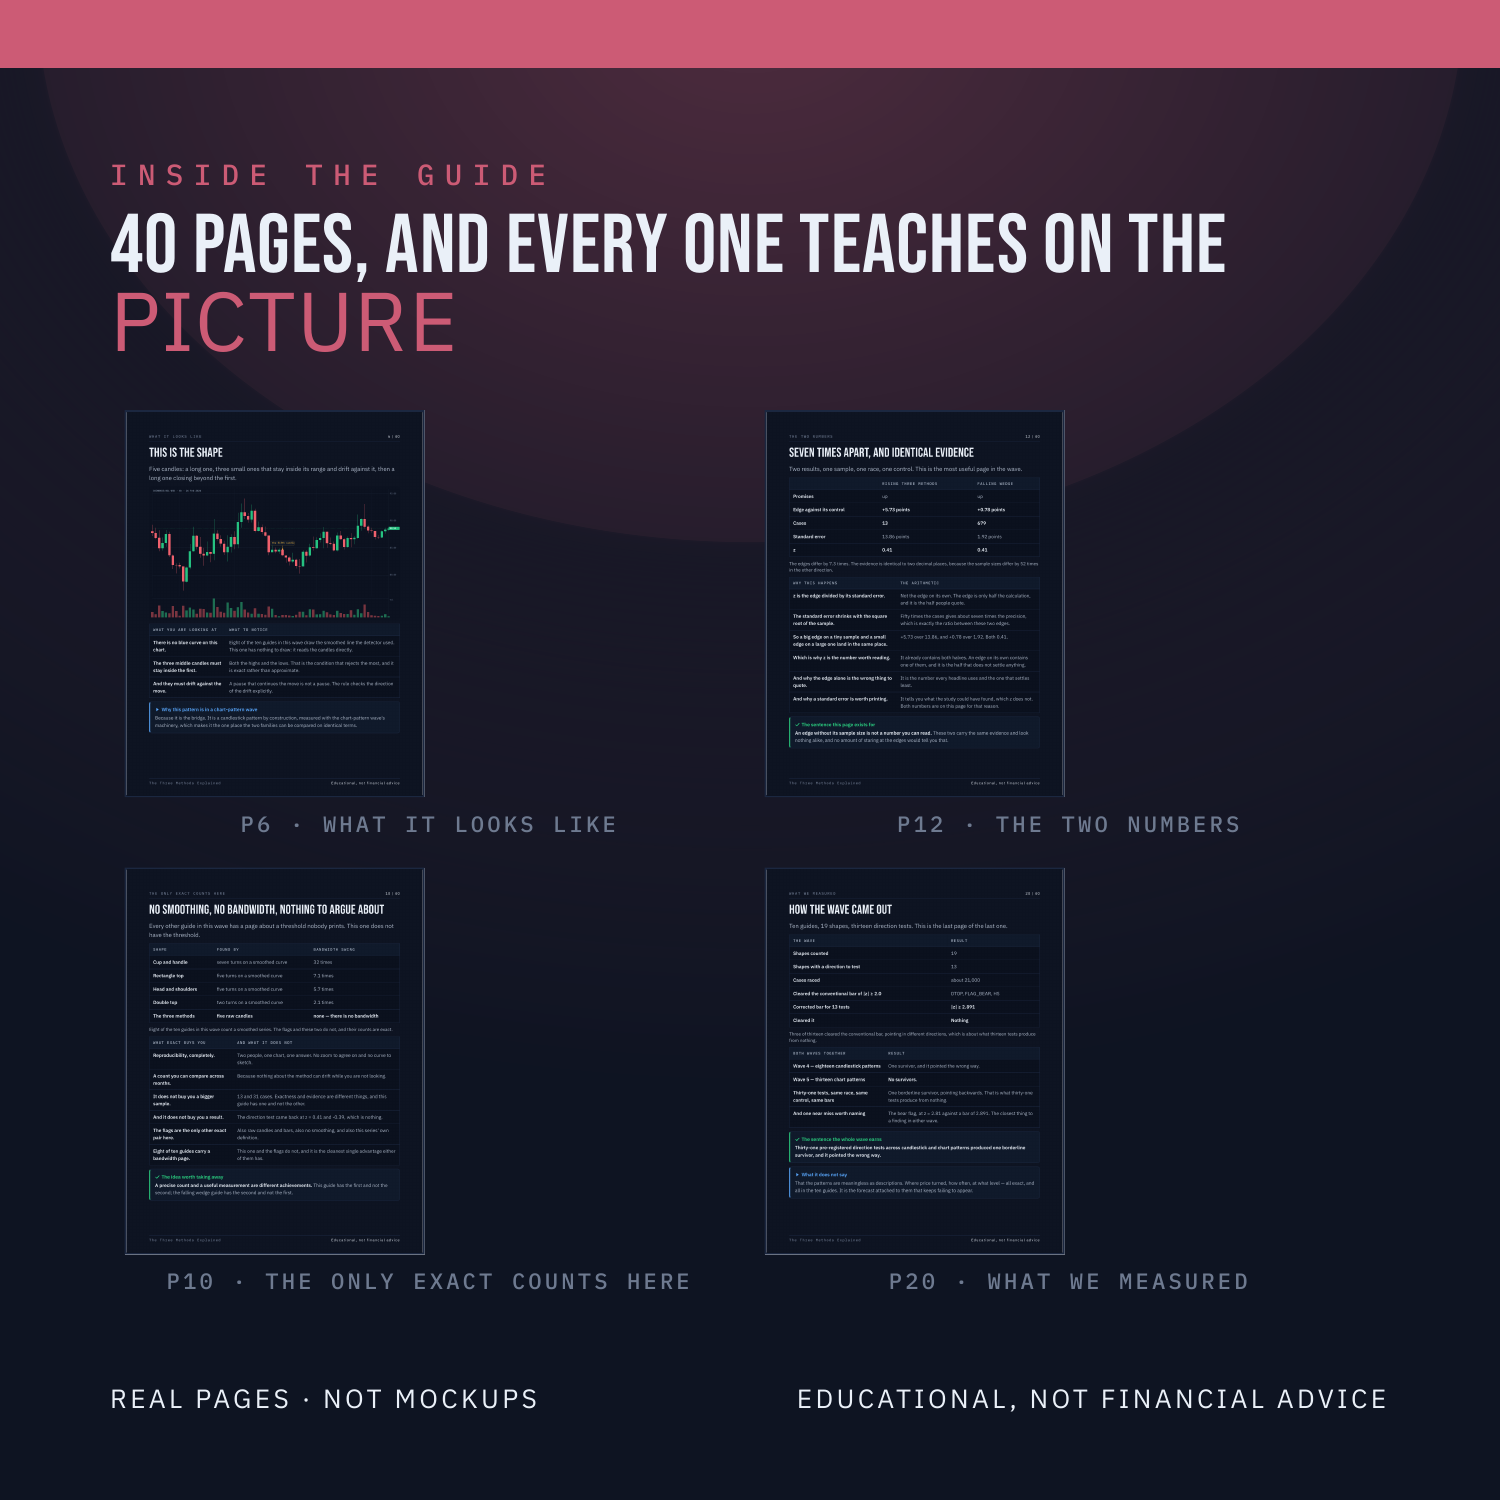
Nothing is taught underneath a chart. Every label sits on the candle, the line or the level it is describing, on real BTC, ETH, SOL and LINK charts. There are three quizzes on real charts, each followed by the same chart re-shown annotated with the reasoning, plus faded practice pages where the first steps are filled in and you finish the rest.
WHAT'S INSIDE
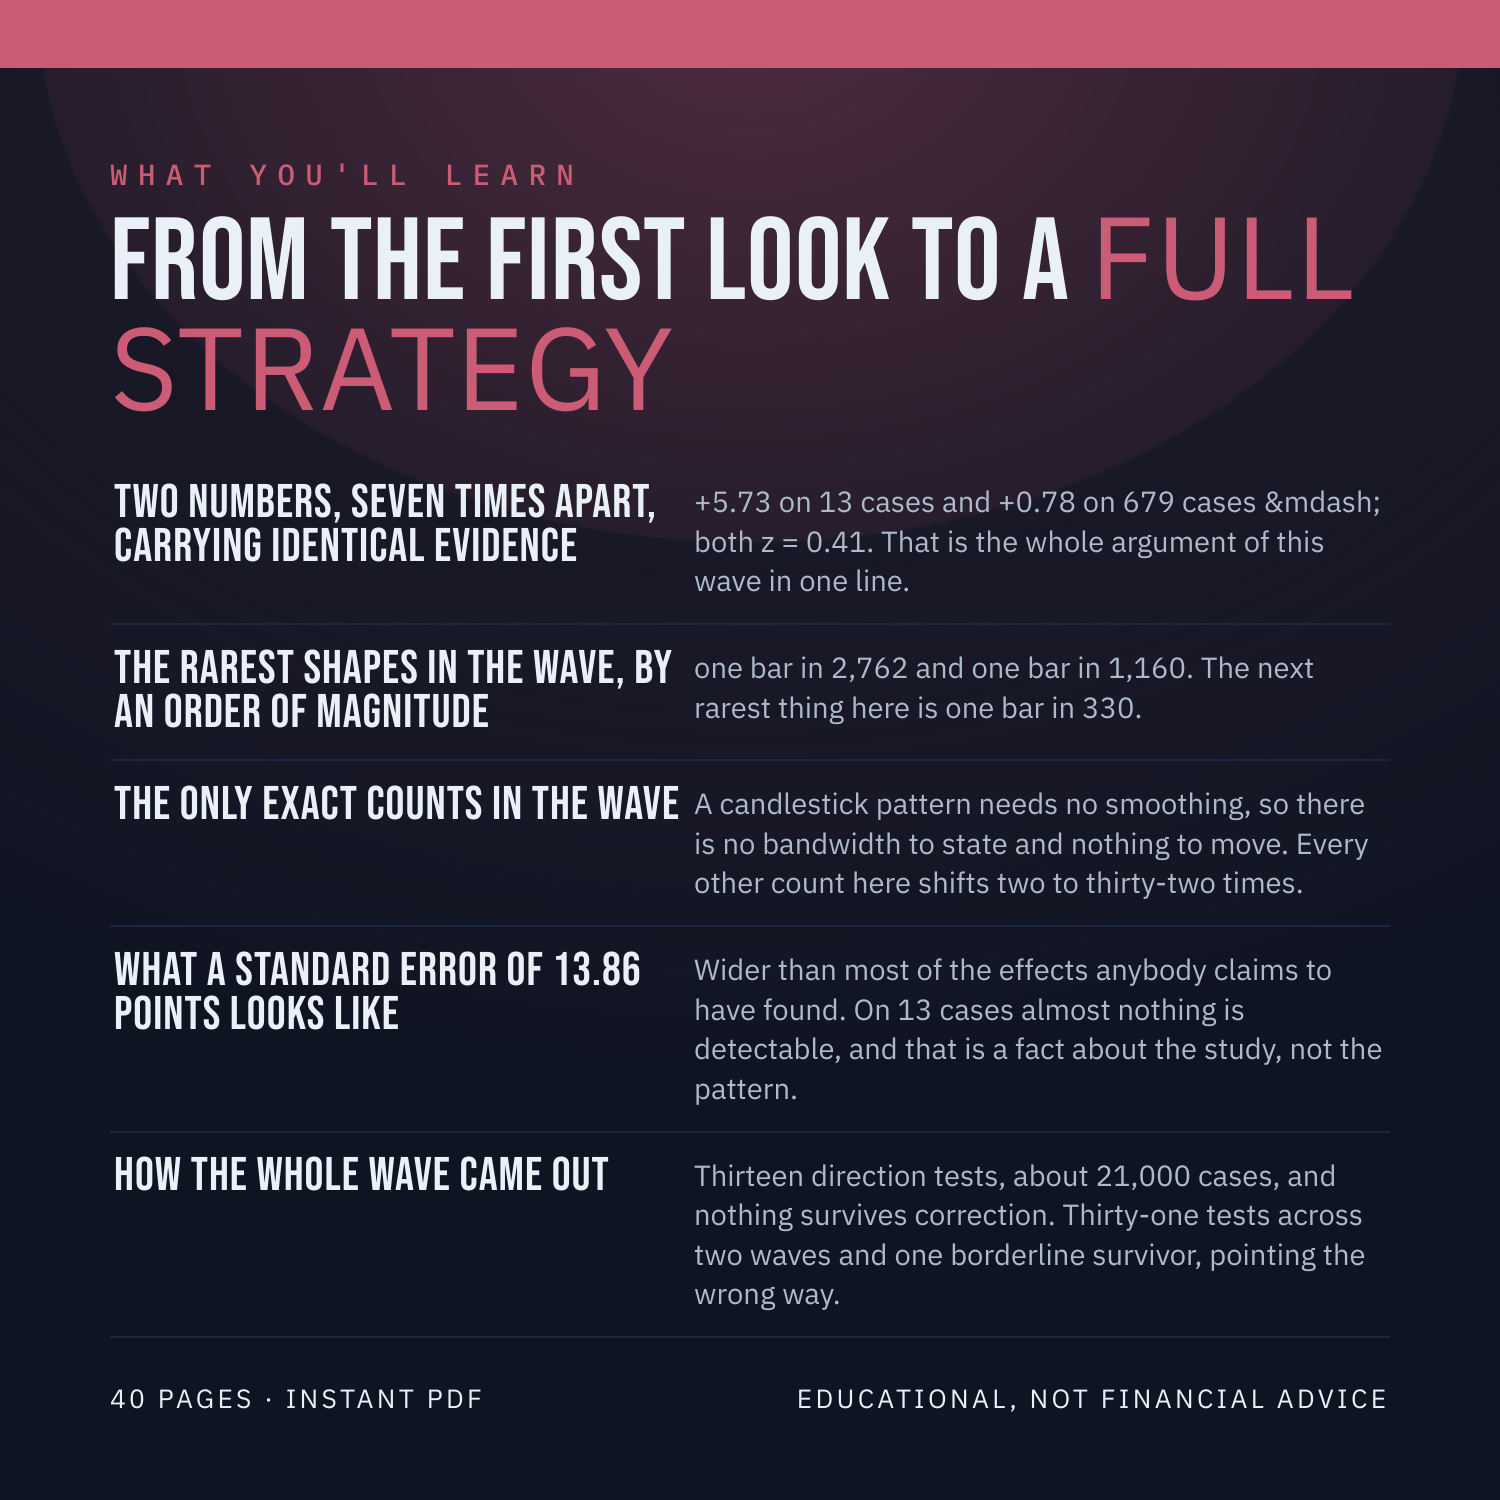
Two numbers, seven times apart, carrying identical evidence - +5.73 on 13 cases and +0.78 on 679 cases, both z = 0.41. That is the whole argument of this wave in one line.
The rarest shapes in the wave, by an order of magnitude - one bar in 2,762 and one bar in 1,160. The next rarest thing here is one bar in 330.
The only exact counts in the wave - a candlestick pattern needs no smoothing, so there is no bandwidth to state and nothing to move. Every other count here shifts two to thirty-two times.
What a standard error of 13.86 points looks like - wider than most of the effects anybody claims to have found. On 13 cases almost nothing is detectable, and that is a fact about the study, not the pattern.
How the whole wave came out - thirteen direction tests, about 21,000 cases, and nothing survives correction. Thirty-one tests across two waves and one borderline survivor, pointing the wrong way.
WHAT YOU'LL BE ABLE TO DO
Read an edge and a sample size together, always.
Say why two results with the same z carry the same evidence.
Mark a three methods by rule, on raw candles.
Explain why exact counts are worth more than large ones.
State what the whole wave found, in one sentence.
AN HONEST NOTE
The three methods is a clue, not a crystal ball. It describes what price has already done. This guide contains no win-rates, no backtest results and no promises about what you will make, because nobody can verify those and you should not trust anyone who prints them. What it hands you instead is a set of rules you can test yourself on TradingView in an afternoon. Educational, not financial advice.
Instant download. 40 pages, PDF.