

Module 9 – Advanced Power BI Analytics & Interactive Dashboards
🚀 Master Advanced Reporting & Interactive Dashboards
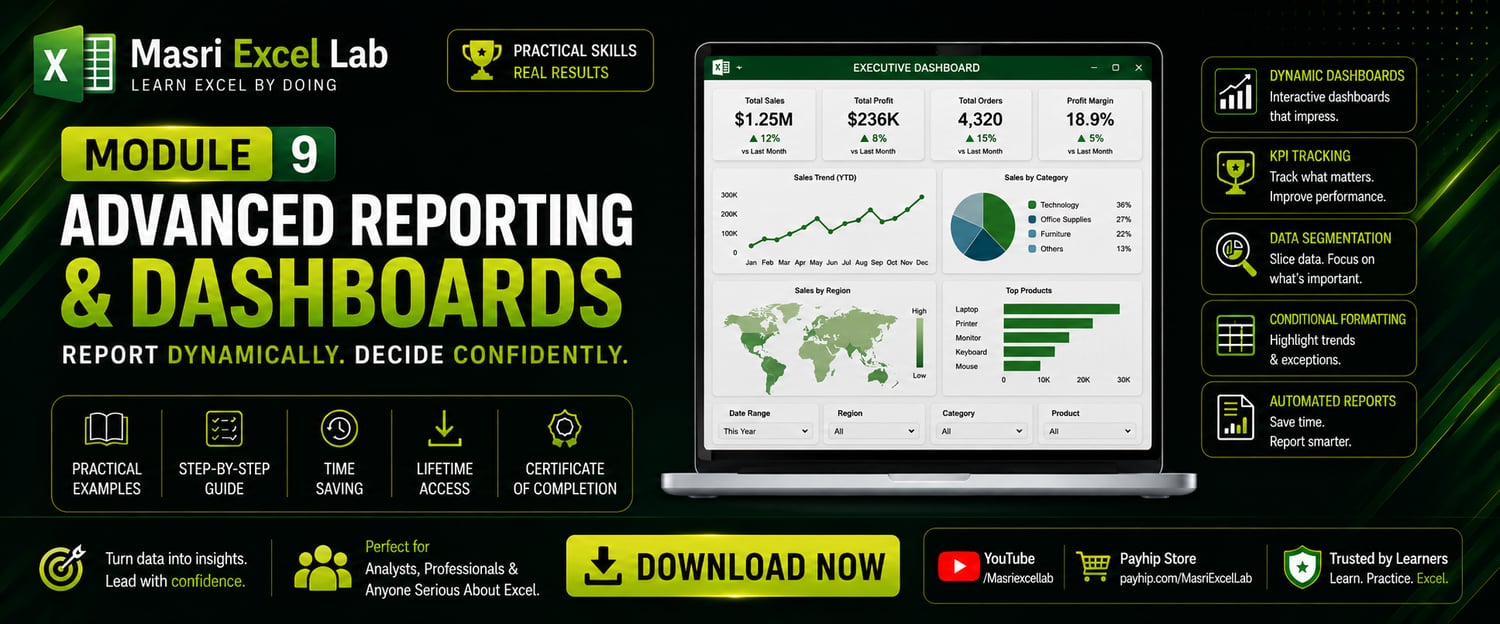
Take your Excel and analytics skills to the next level with Module 9 — Advanced Reporting & Dashboards from Masri Excel Lab.
This premium hands-on training workbook is designed to help you build professional executive dashboards, dynamic reports, KPI tracking systems, and interactive business insights using practical real-world scenarios.
🎯 What You’ll Learn
✅ Build professional executive dashboards
✅ Create dynamic and interactive reports
✅ Design KPI tracking systems
✅ Apply advanced data segmentation techniques
✅ Use slicers, filters, and conditional formatting
✅ Automate reporting workflows
✅ Visualize trends and performance metrics
✅ Transform raw data into actionable insights
📊 Included in This Module
✔ Practical step-by-step exercises
✔ Real business datasets and reporting scenarios
✔ Interactive dashboard examples
✔ KPI and performance tracking models
✔ Professional reporting layouts
✔ Guided practice tasks and solutions
✔ Premium workbook structure and design
💼 Perfect For
- Business Analysts
- Reporting Specialists
- Finance Professionals
- Operations Teams
- Excel Power Users
- Managers & Decision Makers
- Anyone serious about advanced Excel reporting
🔥 Why This Module?
This module focuses on practical reporting skills used in real business environments.
You won’t just learn theory — you’ll build dashboards, analyze KPIs, automate reports, and create professional reporting solutions through hands-on practice.
📥 Important
This product is a downloadable premium training workbook.
To fully benefit from the training, you should purchase and download the included workbook file and follow the guided practical exercises inside the module.
🟢 Masri Excel Lab
Learn Excel by Doing.