
📘 RSI Liquidity Reversal Box – FREE STRATEGY
On Sale
$0.00
📘 RSI Liquidity Reversal Box – FREE STRATEGY
A Simple Guide to Spotting False Breakouts Using RSI
⚠️ Disclaimer
This strategy is for educational purposes only. Trading involves risk. Always use proper risk management and trade responsibly.
🧠 What This Free Strategy Teaches
This guide helps you understand:
- What liquidity is
- Why false breakouts happen
- How RSI shows fake momentum
- A simple, repeatable trade idea
📌 This is a concept-based strategy, perfect for beginners.
🔧 Indicators Used
- RSI (14)
- Candlestick Chart
- (No other indicators required)
⏱ Best Timeframes
- 5-minute
- 15-minute
Best during London or New York session.
📦 STEP 1: Identify the Liquidity Box
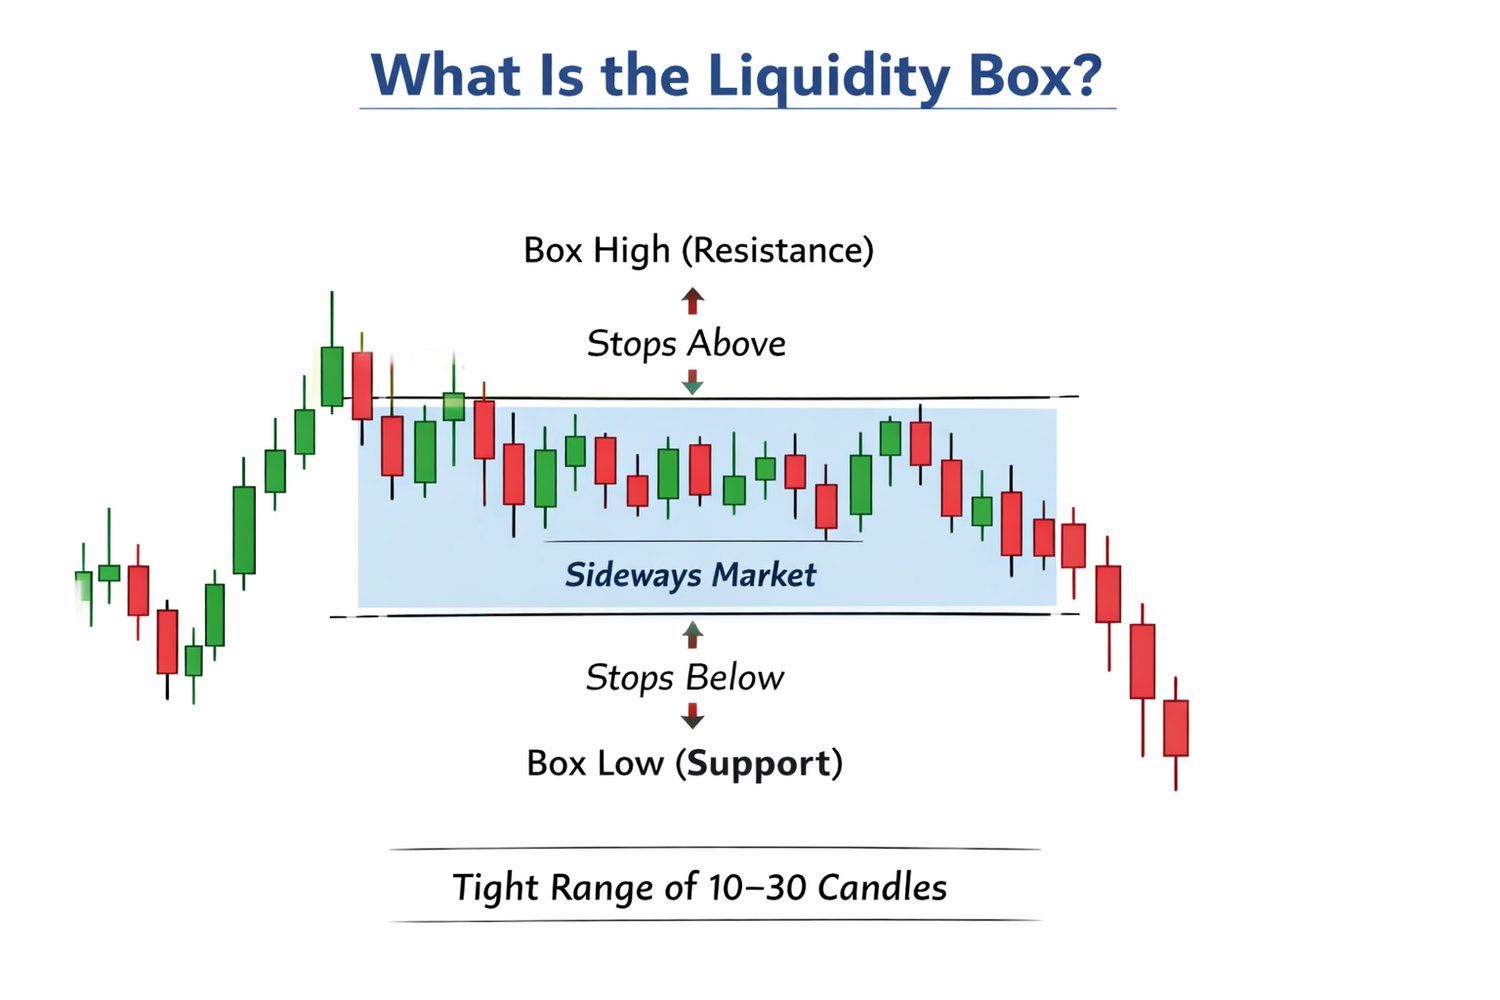
- Find a tight consolidation range (10–30 candles).
- Draw a box around the high and low of the range.
- This box contains resting stop losses.
💥 STEP 2: Watch for Liquidity Sweep
- Price breaks above the box → possible SELL idea
- Price breaks below the box → possible BUY idea
🚫 Do not enter immediately on the breakout.
📉 STEP 3: RSI Confirmation
- RSI above 70 → market may be overbought
- RSI below 30 → market may be oversold
Look for RSI losing momentum after the breakout.
🔁 STEP 4: Simple Entry Rule
- Wait for price to return back inside the box
- Enter in the opposite direction of the breakout
🛑 Stop Loss (Simple)
- Place stop loss above the breakout high (SELL)
- Place stop loss below the breakout low (BUY)
🎯 Take Profit (Simple)
- Target the opposite side of the box
🧮 Basic Risk Management
- Risk only 1% per trade
- Take maximum 1–2 trades per session
- Stop trading after one loss
❌ Common Beginner Mistakes
- Entering during the breakout
- Ignoring RSI
- Trading in low volume sessions
- Over-trading
✅ Final Notes
This free strategy is designed to help you understand market traps, not to overcomplicate trading.
Focus on patience, discipline, and clean setups.
📈 Trade smart. Trade simple.