


Pattern Smasher 2024
Designed for EasyLanguage
REMEMBER to create a directory on your C:\PatternSmasher_Data before installing the ELD and workspaces.
Take your research to a whole new level with this fully disclosed powerful tool. This tool allows you to define a pattern and then analyze all its possible permutations. Is there a 4-bar (or more) pattern that reveals a market edge? Have you ever wondered what the market does after three down closes in a row? How about when you have two inside days in a row? What happens after two inside bars and a breakout to the downside? All these ideas can be easily tested with this new tool. Can you uncover a technical edge and then put it to work for you? Let’s find out.
Introduction
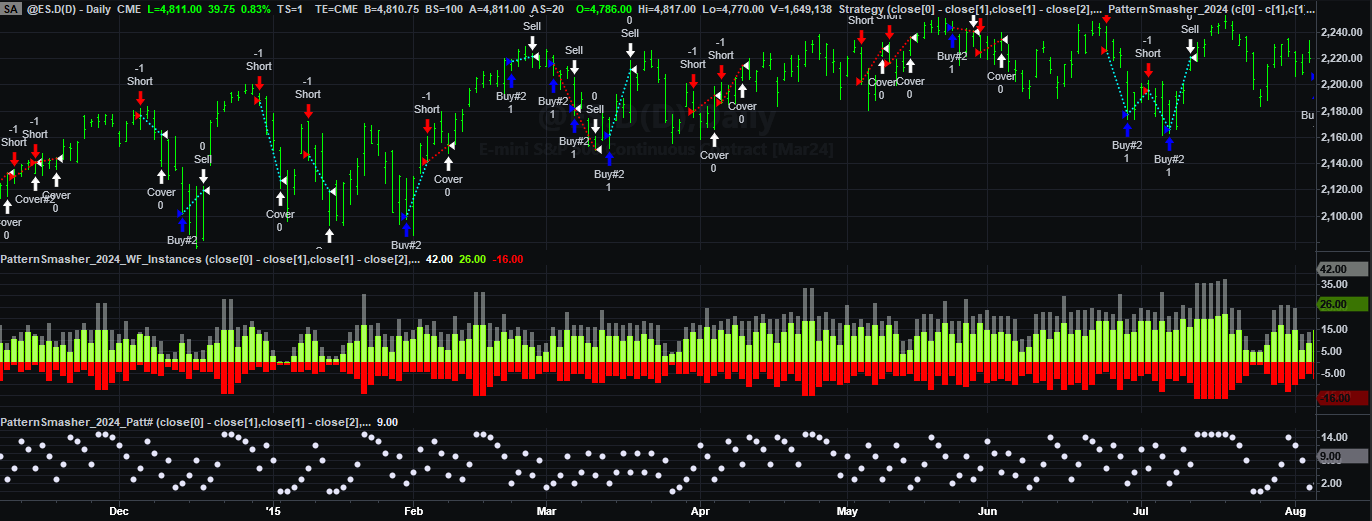
Pattern Smasher 2024 is a very powerful tool that is only limited by your own creativity. All source code is provided to help understand the concepts and for customization. Several templates in the forms of indicators and a strategy are included to get you started. Here is a quick snapshot of some of those templates.
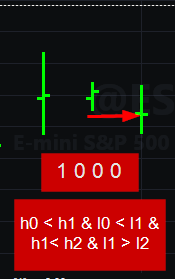
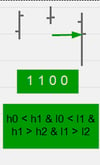
Translating Bars into Formulas
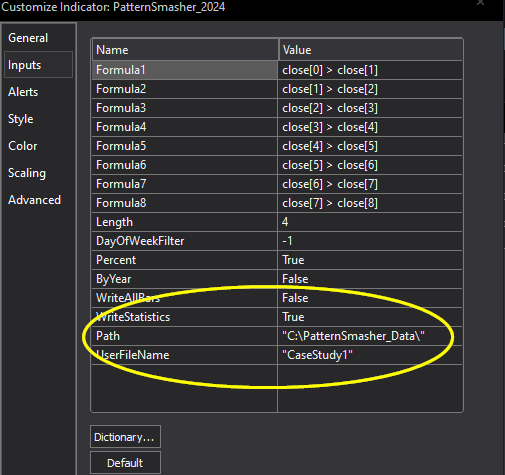
Case Study: 1
Formula1: close[0] > close[1] : if True then 1 else 0;
Formula2: close[1] > close[2] : if True then 1 else 0;
Formula3: close[2] > close[3] : if True then 1 else 0;
Formula4: close[3] > close[4] : if True then 1 else 0;
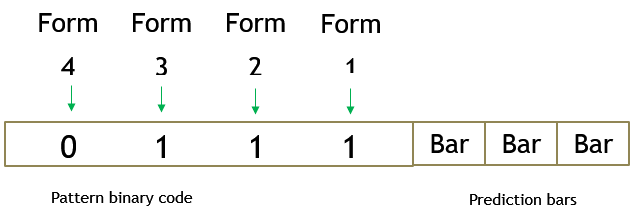
You can create a customized report to see how your pattern held up for 1 or 2 or 3 days.
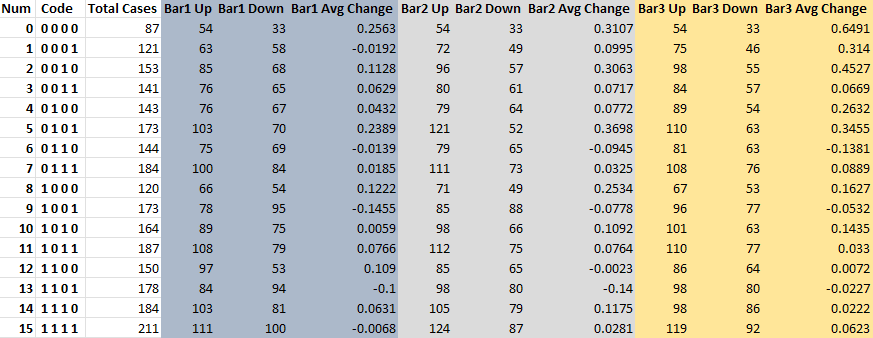
Here, buy after four down closes reflects nearly 64% appreciation in price after three days. That is not 100% accurate, because of repeating the same pattern for more than one day. But it does show a positive expectancy. All you need to do is plug in your own formulas to create your pattern. You can look at the last four or more days or you can look at four different criteria across fewer days. You also get the following example.
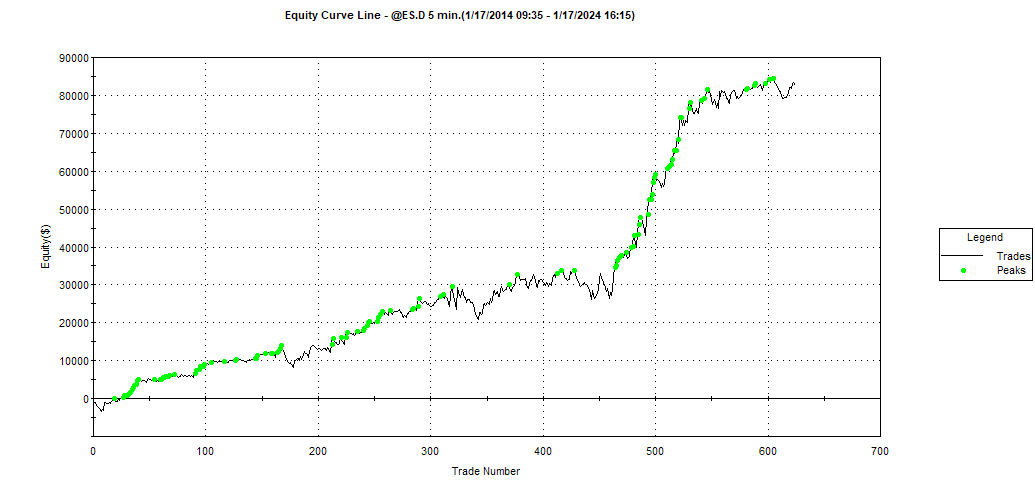
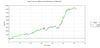
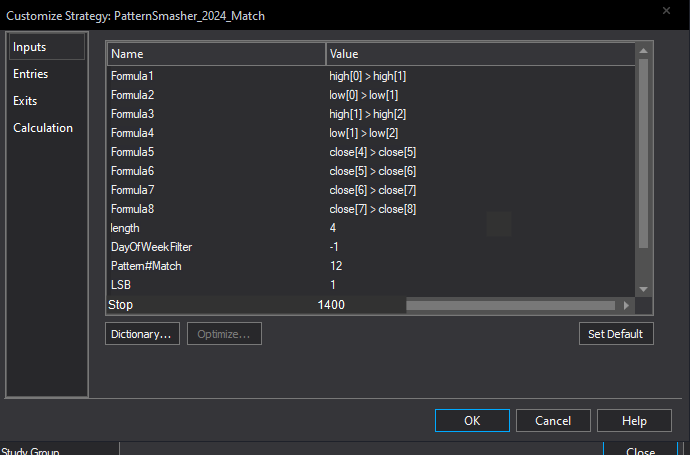
Here we are looking across three days to see the relationship of today's high and low versus yesterday's high and low plus the relationship between yesterday's high and low the prior day's values. Based on research of this pattern, and another pattern for short trades, the following equity curve was created on the ES.D with $0 execution costs.
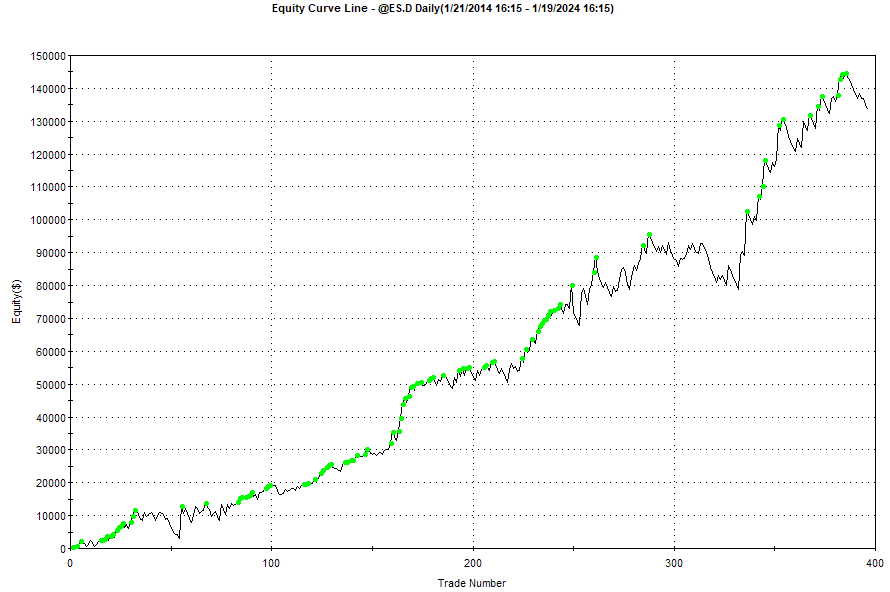
CFTC-required risk disclosure for hypothetical results:
Hypothetical performance results have many inherent limitations, some of which are described below. No representation is being made that any account will or is likely to achieve profits or losses similar to those shown. in fact, there are frequently sharp differences between hypothetical performance results and the actual results subsequently achieved by any particular trading program.
One of the limitations of hypothetical performance results is that they are generally prepared with the benefit of hindsight. In addition, hypothetical trading does not involve financial risk, and no hypothetical trading record can completely account for the impact of financial risk in actual trading. For example, the ability to withstand losses or to adhere to a particular trading program in spite of trading losses are material points which can also adversely affect actual trading results. There are numerous other factors related to the markets in general or to the implementation of any specific trading program which cannot be fully accounted for in the preparation of hypothetical performance results and all of which can adversely affect actual trading results.
Here is a link to an introductory video.