

Crypto Trading Journal — Free Edition
No account and no card. Just an email address, and the file downloads immediately.
FREE. THE TRADING JOURNAL BUILT FOR CRYPTO.
Add up everything you paid last quarter in trading fees, funding and gas. Most active traders have never done that arithmetic once.
No single line looks scary. Four dollars in fees. Twelve dollars in funding over a three-day hold. Two dollars in gas. You would never take a trade for eighteen dollars, but you pay it twenty times a month and it never appears on a single screenshot.
Most trading journals cannot help you here, because almost all of them are forex or stocks templates with a crypto label added later. One column for fees and nothing else. No idea what funding is, no concept of gas, no way to tell a spot buy from a 5x perp.
This one is built for how crypto actually trades. And it is free.
WHAT YOU GET
Trade Log. 200 rows. Venue and venue type (Spot CEX, Perp CEX, Margin, Spot DEX, Perp DEX), chain, asset, direction, leverage, entry, stop, target, exit, size. Then trading fees, funding entered signed so negative when you paid and positive when you were paid, and gas, each in its own column. Position value, margin used, planned risk, risk as a percent of capital, gross PnL, total friction, net PnL, R-multiple and return on margin are computed for you. Colour scales on net PnL and R so a hundred rows are scannable at a glance.
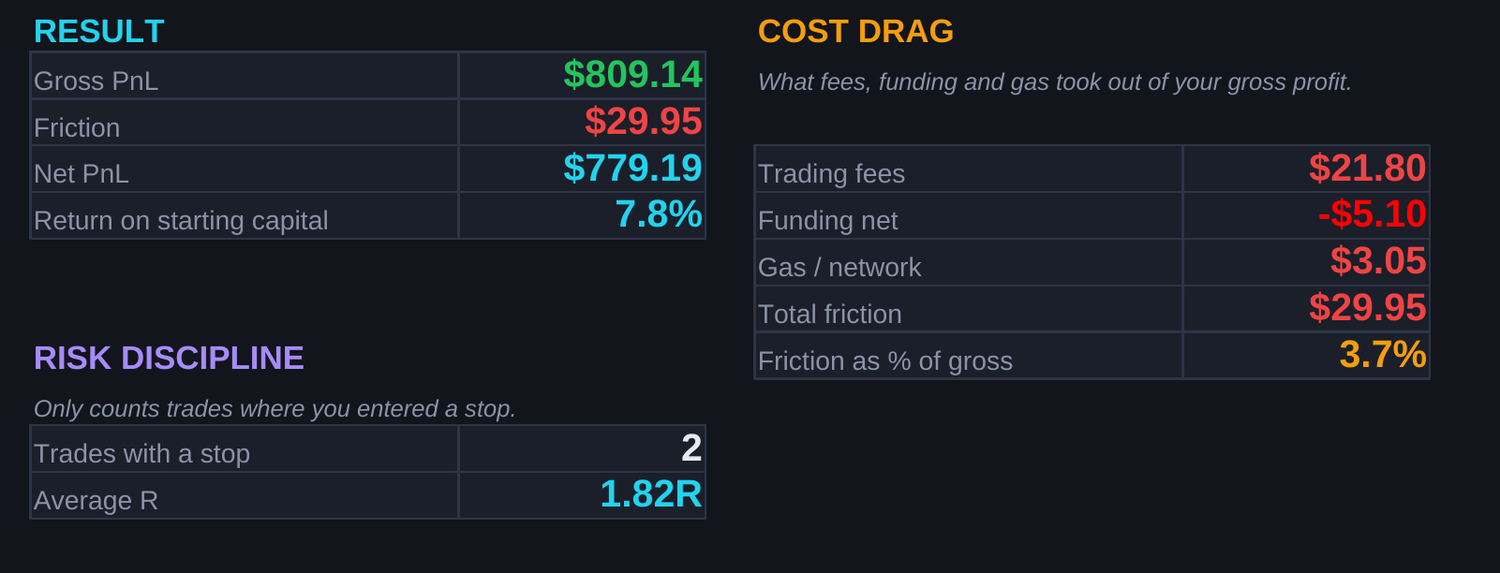
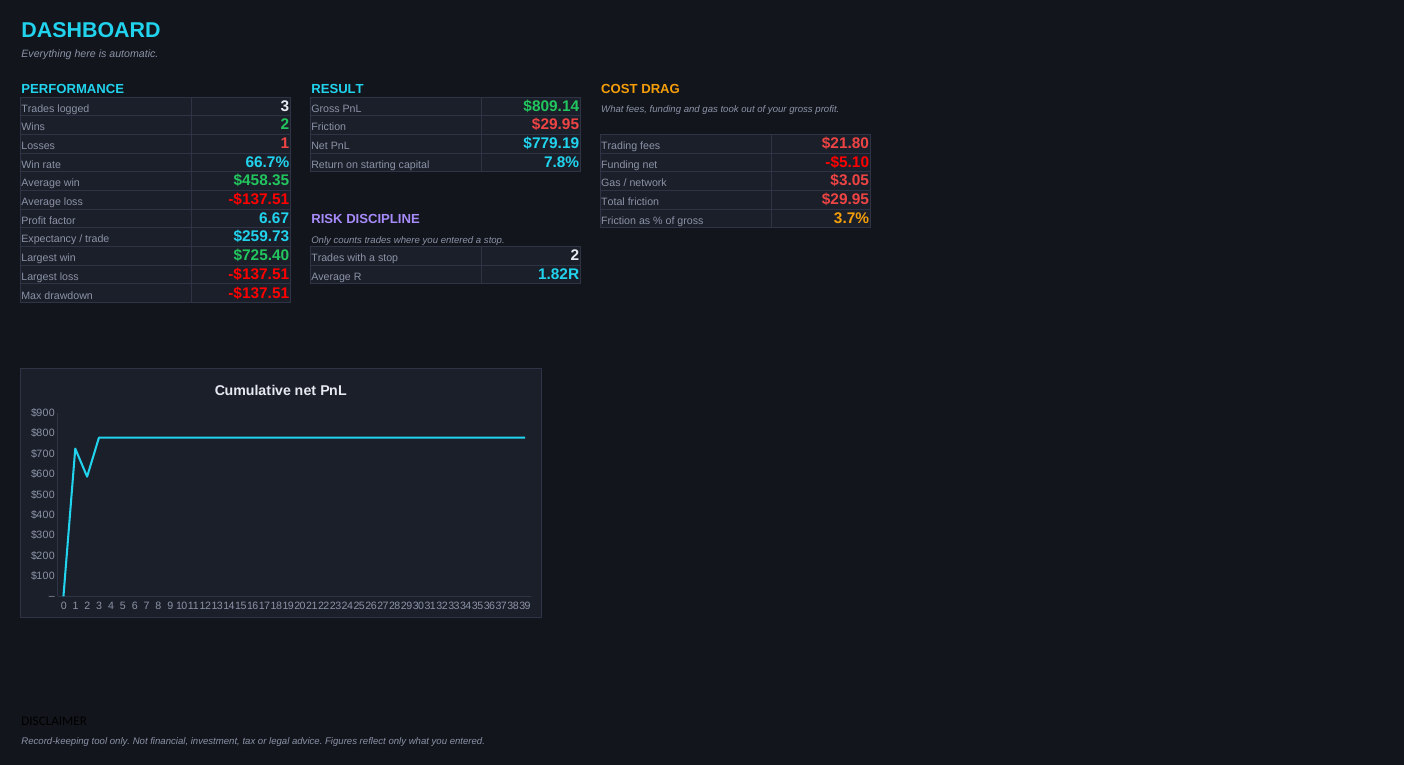
Dashboard. Win rate, average win and loss, profit factor, expectancy per trade, largest win and loss, and a real max drawdown computed from a running equity curve. Your cumulative net PnL as a chart. Then your gross PnL, your total friction, and the number most traders have never seen: friction as a percentage of gross profit.
Settings. Base currency, starting capital, a position sizing calculator that works out your size from your risk percentage and your stop distance, and editable lists for venues, chains, setups and mistakes.
WHY THE STOP COLUMN MATTERS
Enter the stop you actually used and the sheet works out your planned risk, then scores every trade as a multiple of it. A trade that made $50 risking $500 is not the same trade as one that made $50 risking $25, and only one of those is repeatable. Leave it blank and everything else still works; you just lose the R column.
HOW IT IS BUILT
A real .xlsx file. Not a PDF with a link inside it, which is somehow common in this category.
It opens in Excel and imports cleanly into Google Sheets. No Tables, no macros, no add-ons, no external links, no account. Nothing leaves your machine. Every formula is visible and unlocked, so you can add a column or change a calculation whenever you want.
WHAT IT DOES NOT DO
It does not import your trades. You type them, or paste them from a CSV.
It does not handle scaling in and out. One row is one complete trade.
It does not do your taxes and produces no official form of any kind.
It is not advice. It is a record of what you did.
IF YOU WANT MORE LATER
The Full Edition breaks your cost drag down by venue, by asset and month by month, so you can see which exchange or which chain is actually taxing you. It adds an Open Positions tab with unrealised PnL, a behaviour analysis showing what each setup earns and each mistake costs, drawdown in percent, longest losing streak, average hold time, 1,000 rows, and the code to pull live prices into Google Sheets with your own free key. That one is paid.
This one is complete on its own. Use it for a month before you decide anything.
DISCLAIMER
This file is a record-keeping tool. It is not financial, investment, tax or legal advice, and it produces no official tax document. All figures reflect only what you enter. Verify anything you rely on, and speak to a qualified professional about tax.