

Manim codes : plot and draw graphs "cos" "sin" functions and points
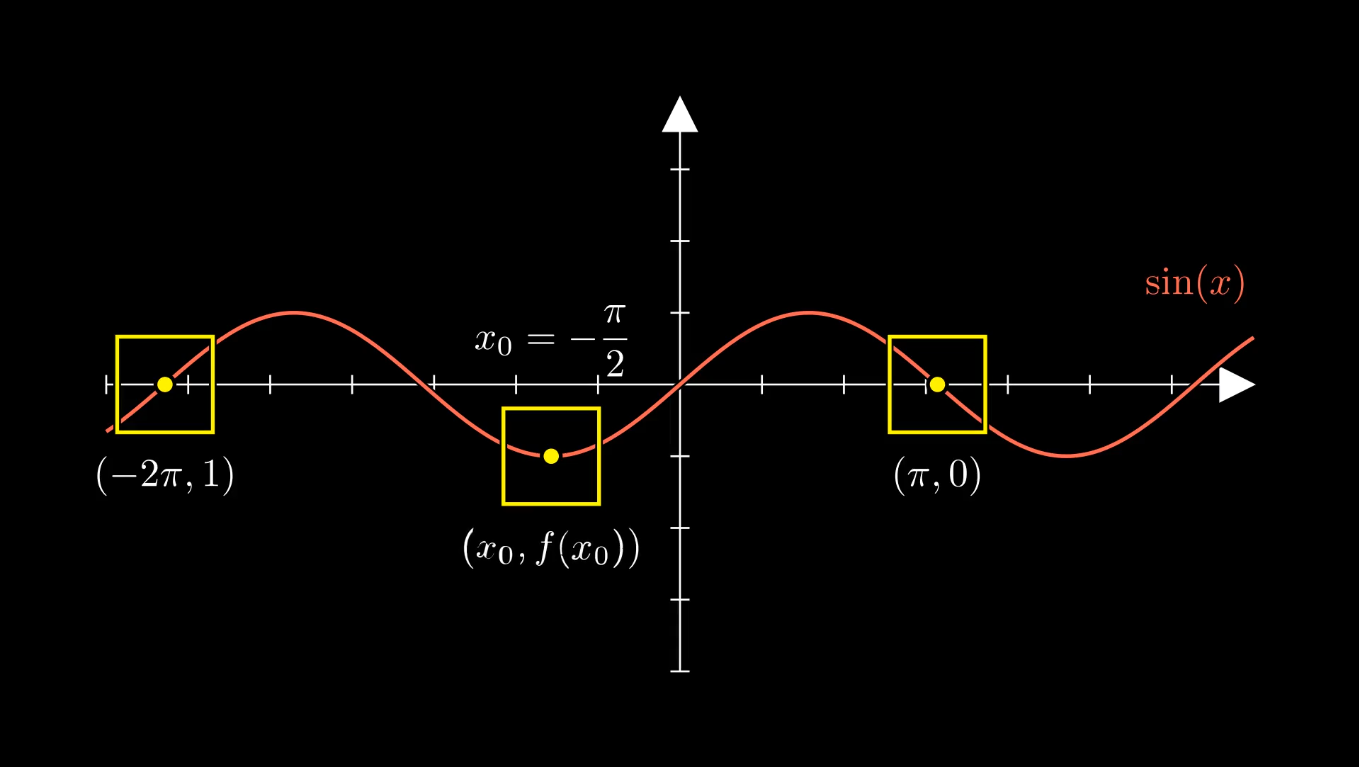
These codes create animations using the Manim library to visualize the sine and cosine functions. They plot the curves on a set of axes, highlight specific points with squares and dots, and add text annotations to show the coordinates of these points.
These visualizations help students understand mathematical concepts more clearly and make learning more engaging. Teachers can use these animations as teaching aids to explain complex topics effectively. Additionally, the codes are customizable, allowing you to modify them to suit your specific needs or lesson plans.
Visual Learning: These animations help students visualize mathematical functions, making abstract concepts more concrete.
Interactive Understanding: By seeing the points and their coordinates on the graph, students can better understand the relationship between the function and its values.
Engagement: Animations can make learning more engaging and enjoyable, helping to maintain students’ interest in the subject.
Teaching Aid: These visualizations can be used as teaching aids to explain concepts more effectively during lectures or presentations.
Clarification: They help clarify complex topics by providing a visual representation, which can be particularly useful for students who struggle with traditional methods of learning.
Versatility: Teachers can modify the code to create custom animations tailored to their lesson plans, making it a versatile tool for various educational purposes.
These animations serve as powerful tools to enhance the teaching and learning experience in mathematics, making it easier to grasp and retain complex concepts.