


Super Arrow Indicator for MetaTrader5 Download - Free - [TF Lab]
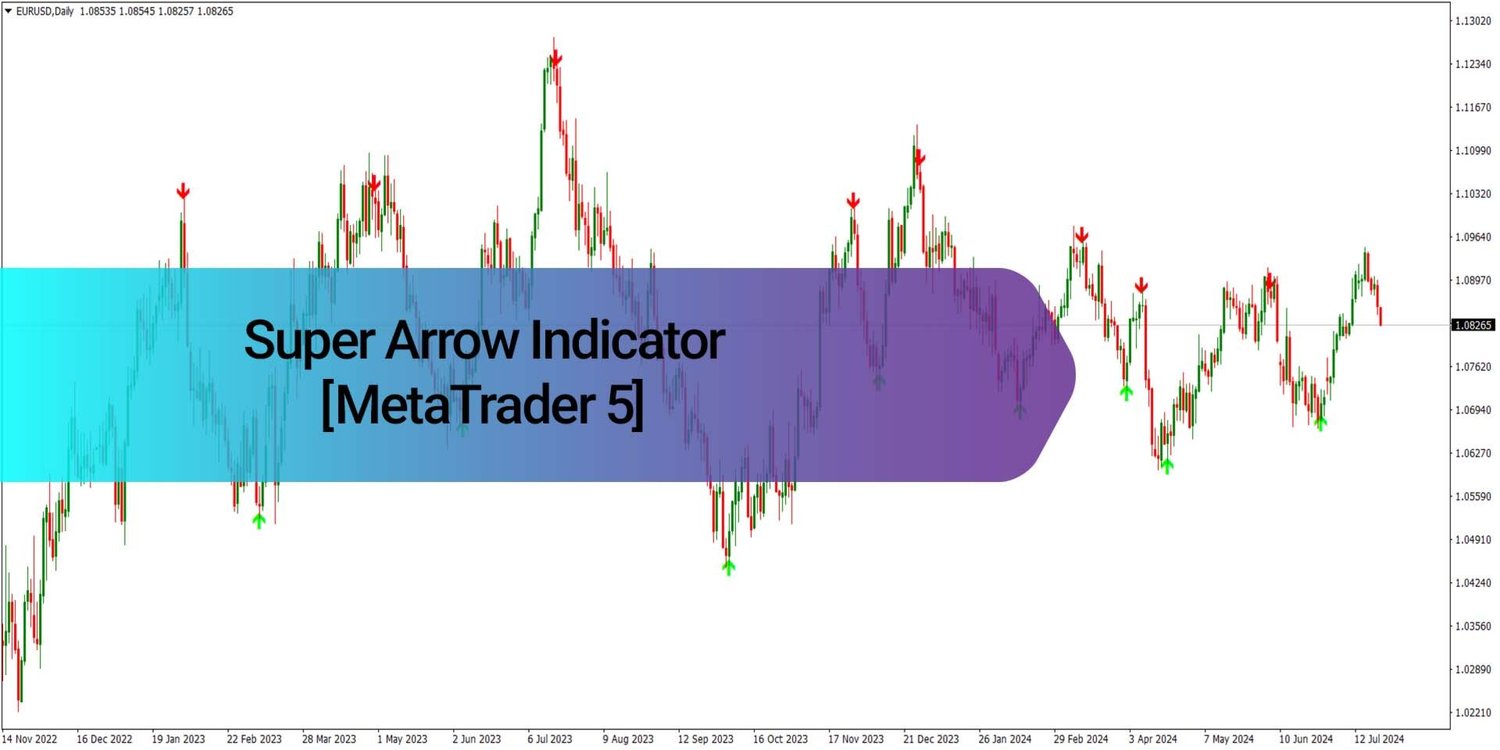
The Super Arrow Indicator on MT5 is a multi-signal trading tool that combines RSI 📊, Bollinger Bands 📈, Moving Averages, and Magic Filter 🪄 to detect pivot highs and lows and trend reversal points.
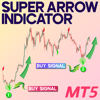
It visually marks swing lows with green arrows 🟢 for potential buy entries and swing highs with red arrows 🔴 for potential sell entries, giving traders an easy-to-follow guide for strategic decisions.
📌 Indicator Overview
- Categories: Pivot Points & Fractals, Signal & Forecast, Trading Assist
- Platform: MetaTrader 5
- Skill Level: Beginner to Intermediate
- Indicator Type: Lagging & Reversal
- Timeframes: M15, M30, H1, H4
- Trading Styles: Day Trading, Swing Trading, Intraday
- Markets: Forex 💱, Crypto ₿, Indices 📈, Binary Options 🎯
⚡ How It Works
The Super Arrow Indicator filters multiple signals to reduce false alerts and highlight high-probability trading points:
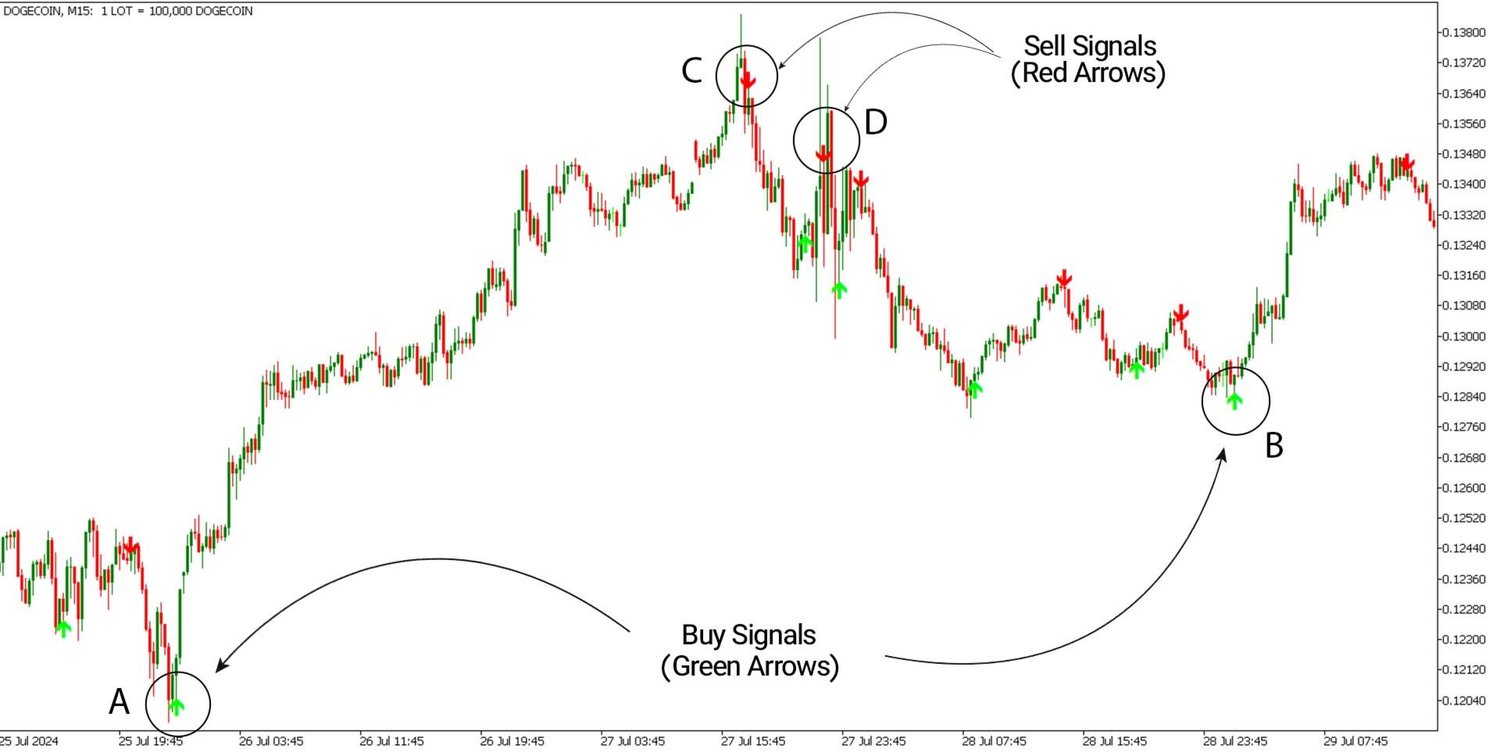
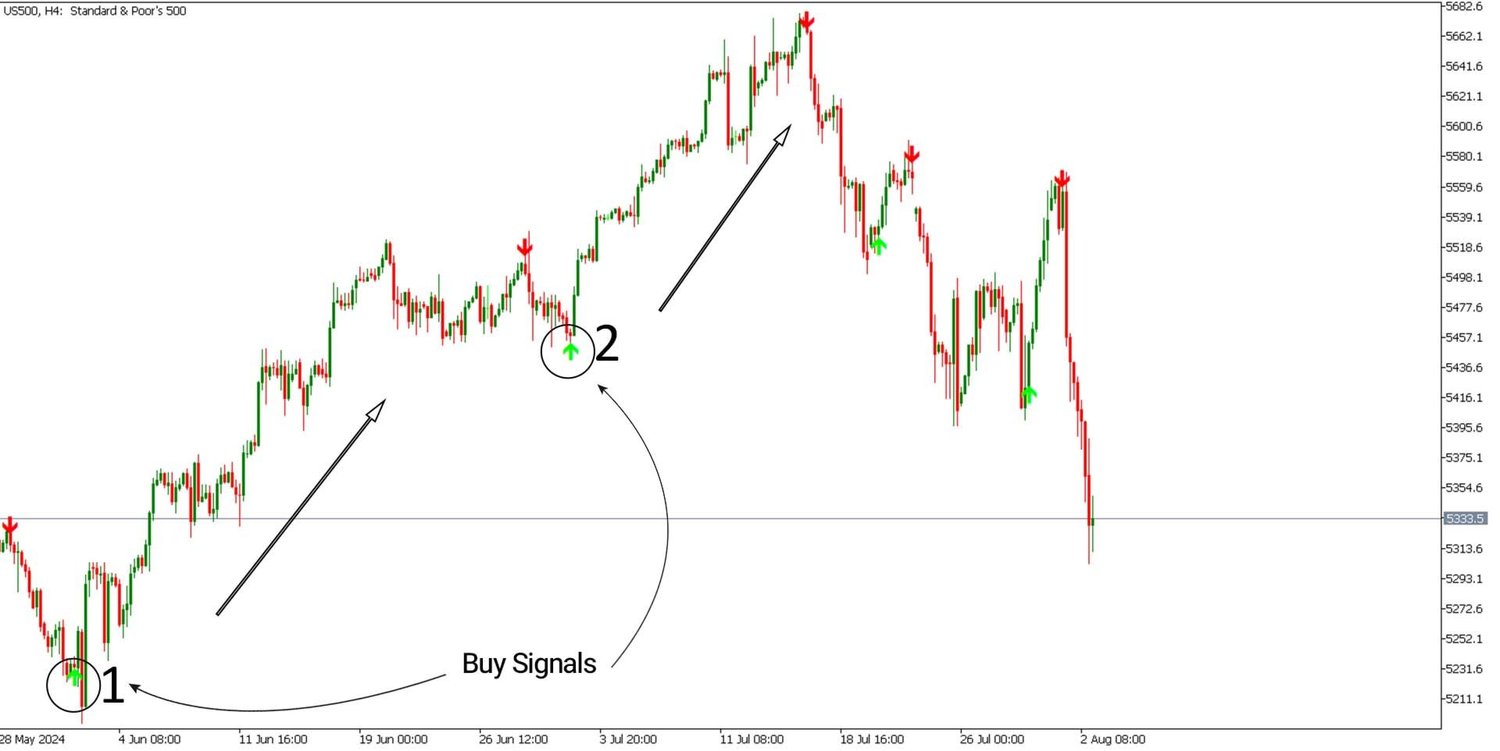
- Buy Signals 🟢: Trigger at swing lows when the market shows bullish tendencies. Confirm entries using support levels, trend lines, or candlestick patterns.
- Sell Signals 🔴: Trigger at swing highs when the market shows bearish tendencies. Use resistance levels, trend channels, or reversal patterns for confirmation.
Example Charts:
- Dogecoin (M15): Green arrows 🟢 mark pivot lows for potential buys; red arrows 🔴 indicate pivot highs for sells.
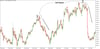
- S&P 500 (H4): Signals appear at major turning points, guiding trade entries.
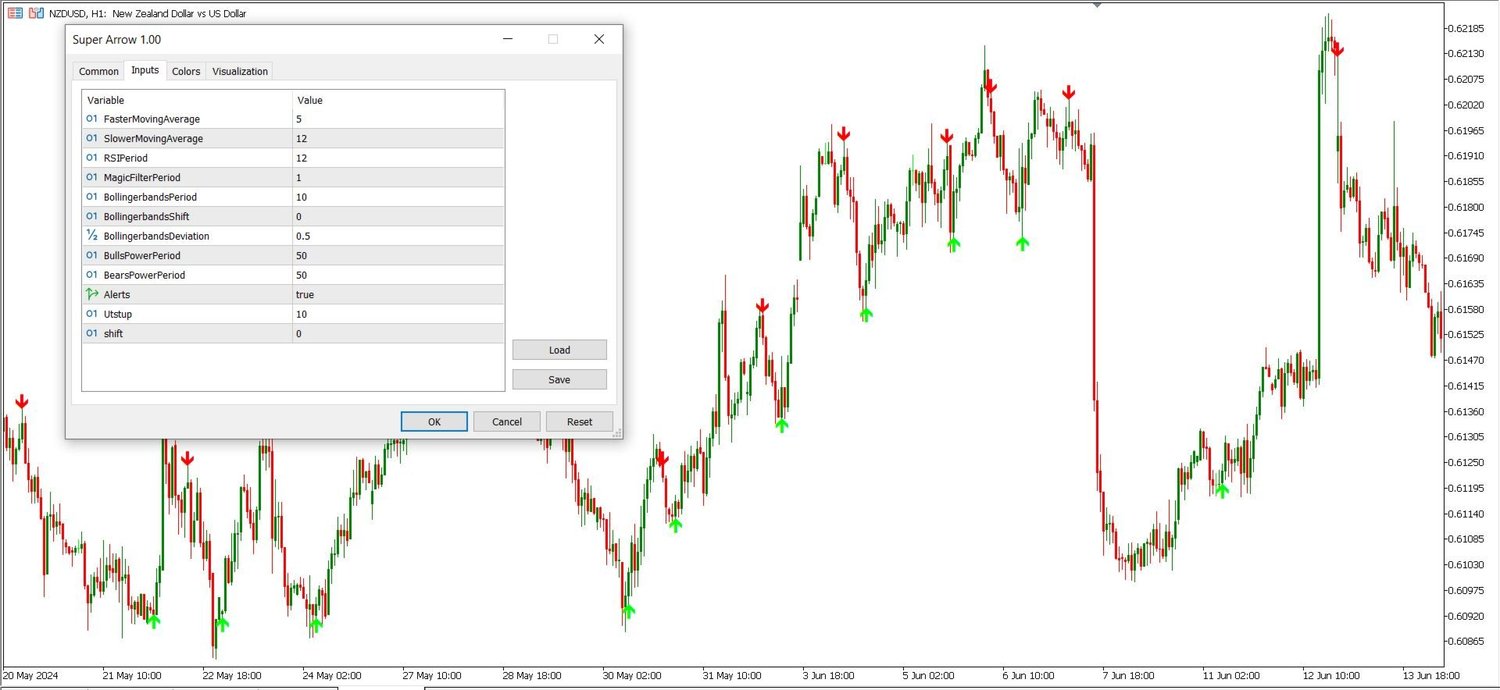
- NZD/USD (H1): Red arrows 🔴 highlight swing highs for sell opportunities.
⚙️ Indicator Settings
- Faster Moving Average: 5
- Slower Moving Average: 12
- RSI Period: 12
- Magic Filter Period: 1
- Bollinger Bands Period: 10
- Bollinger Bands Shift: 0
- Bollinger Bands Deviation: 0.5
- Bulls Power Period: 50
- Bears Power Period: 50
- Alerts: ✅ Enabled
- Utstup: 10
- Shift: 0
These settings allow customization for different trading instruments and timeframes.
✅ Key Takeaways
The Super Arrow Indicator is ideal for spotting critical market highs and lows across multiple assets and timeframes. By combining multiple indicators, it improves signal reliability and highlights high-probability entry points.
For optimal results, use it alongside trend channels 📏, Fibonacci levels ✨, support/resistance lines 📉, and divergence analysis 🔄 to strengthen trading decisions and reduce risk.