
Annual Budget Dashboard — Yearly Spreadsheet with Charts (Excel + Google Sheets)
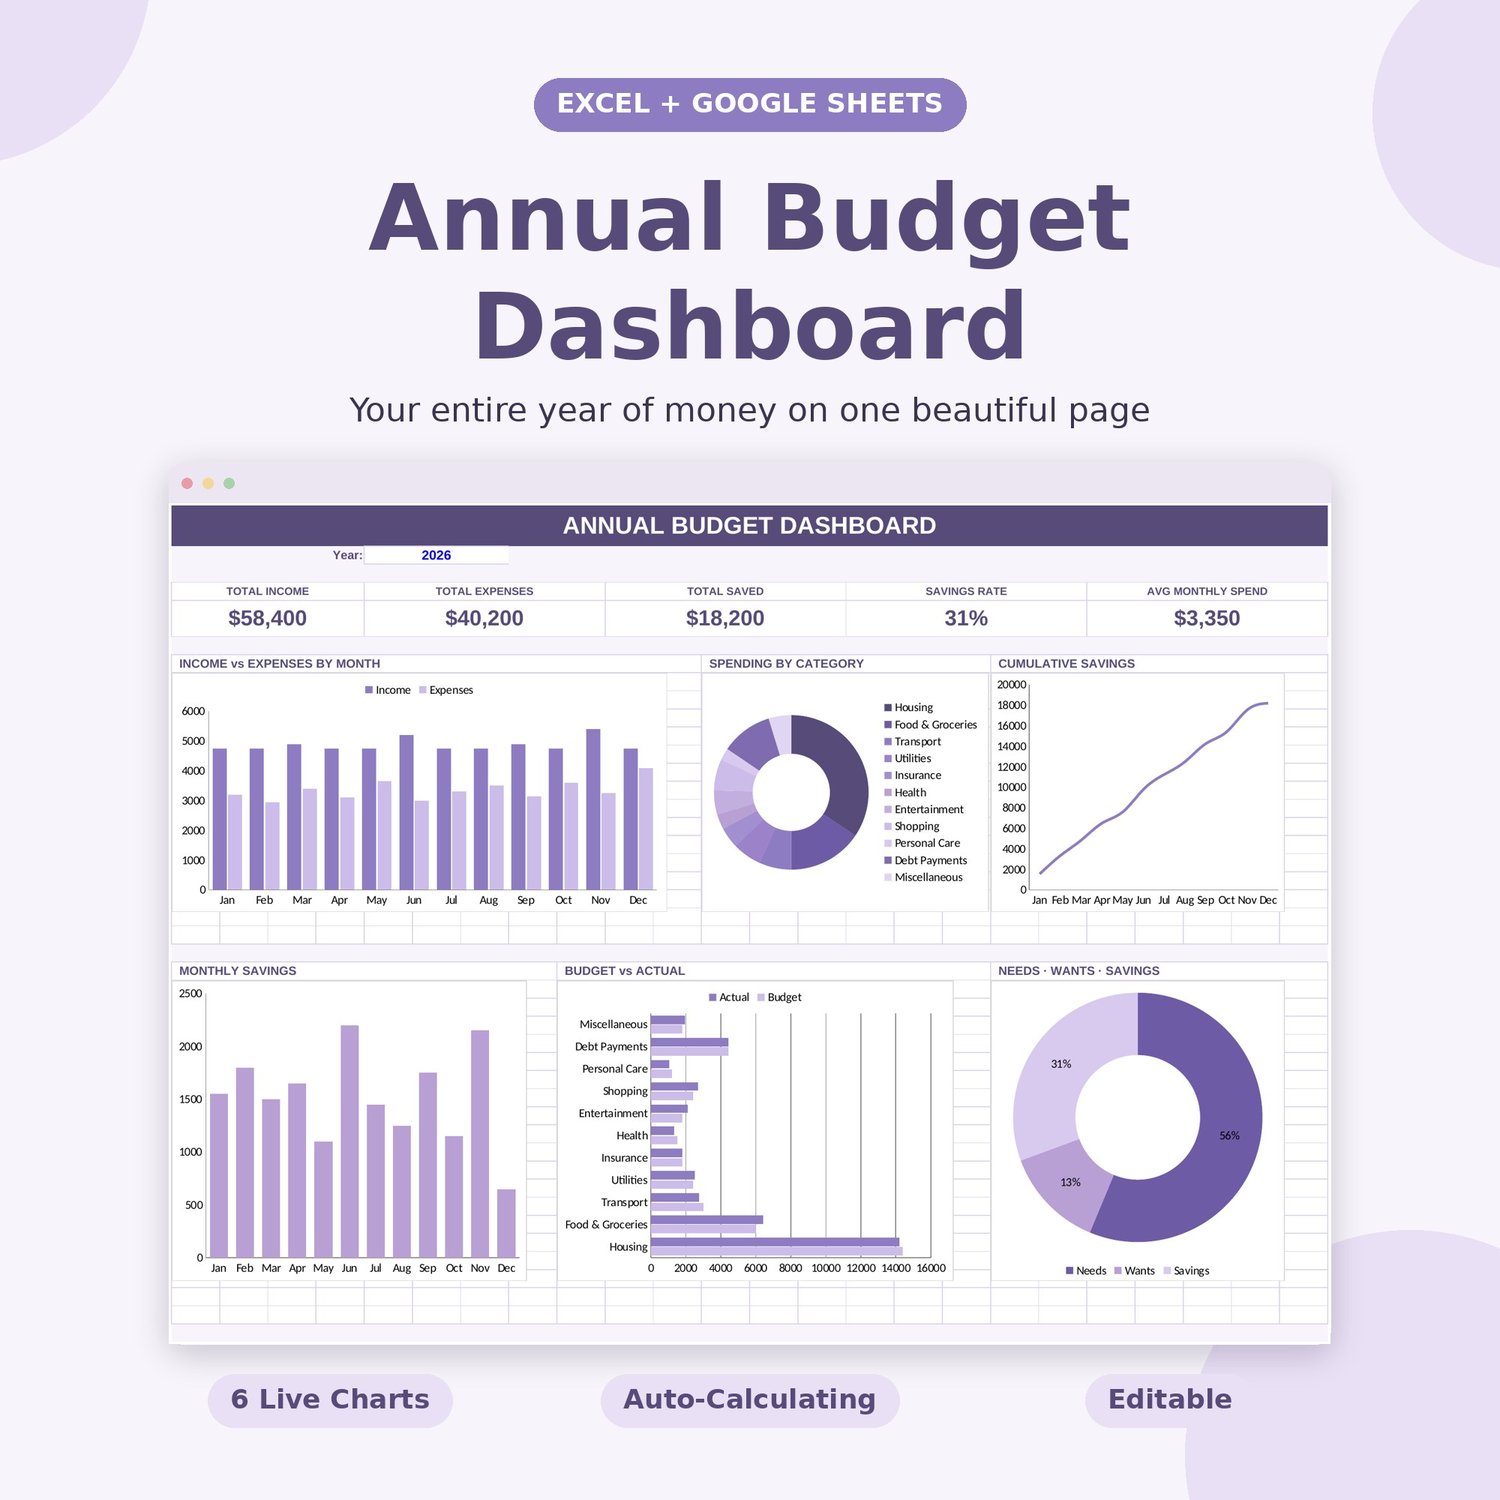
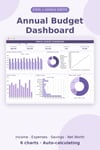
Your entire year of money on one beautiful page — six live charts that update themselves as you type.
✨ The whole year, at a glance.
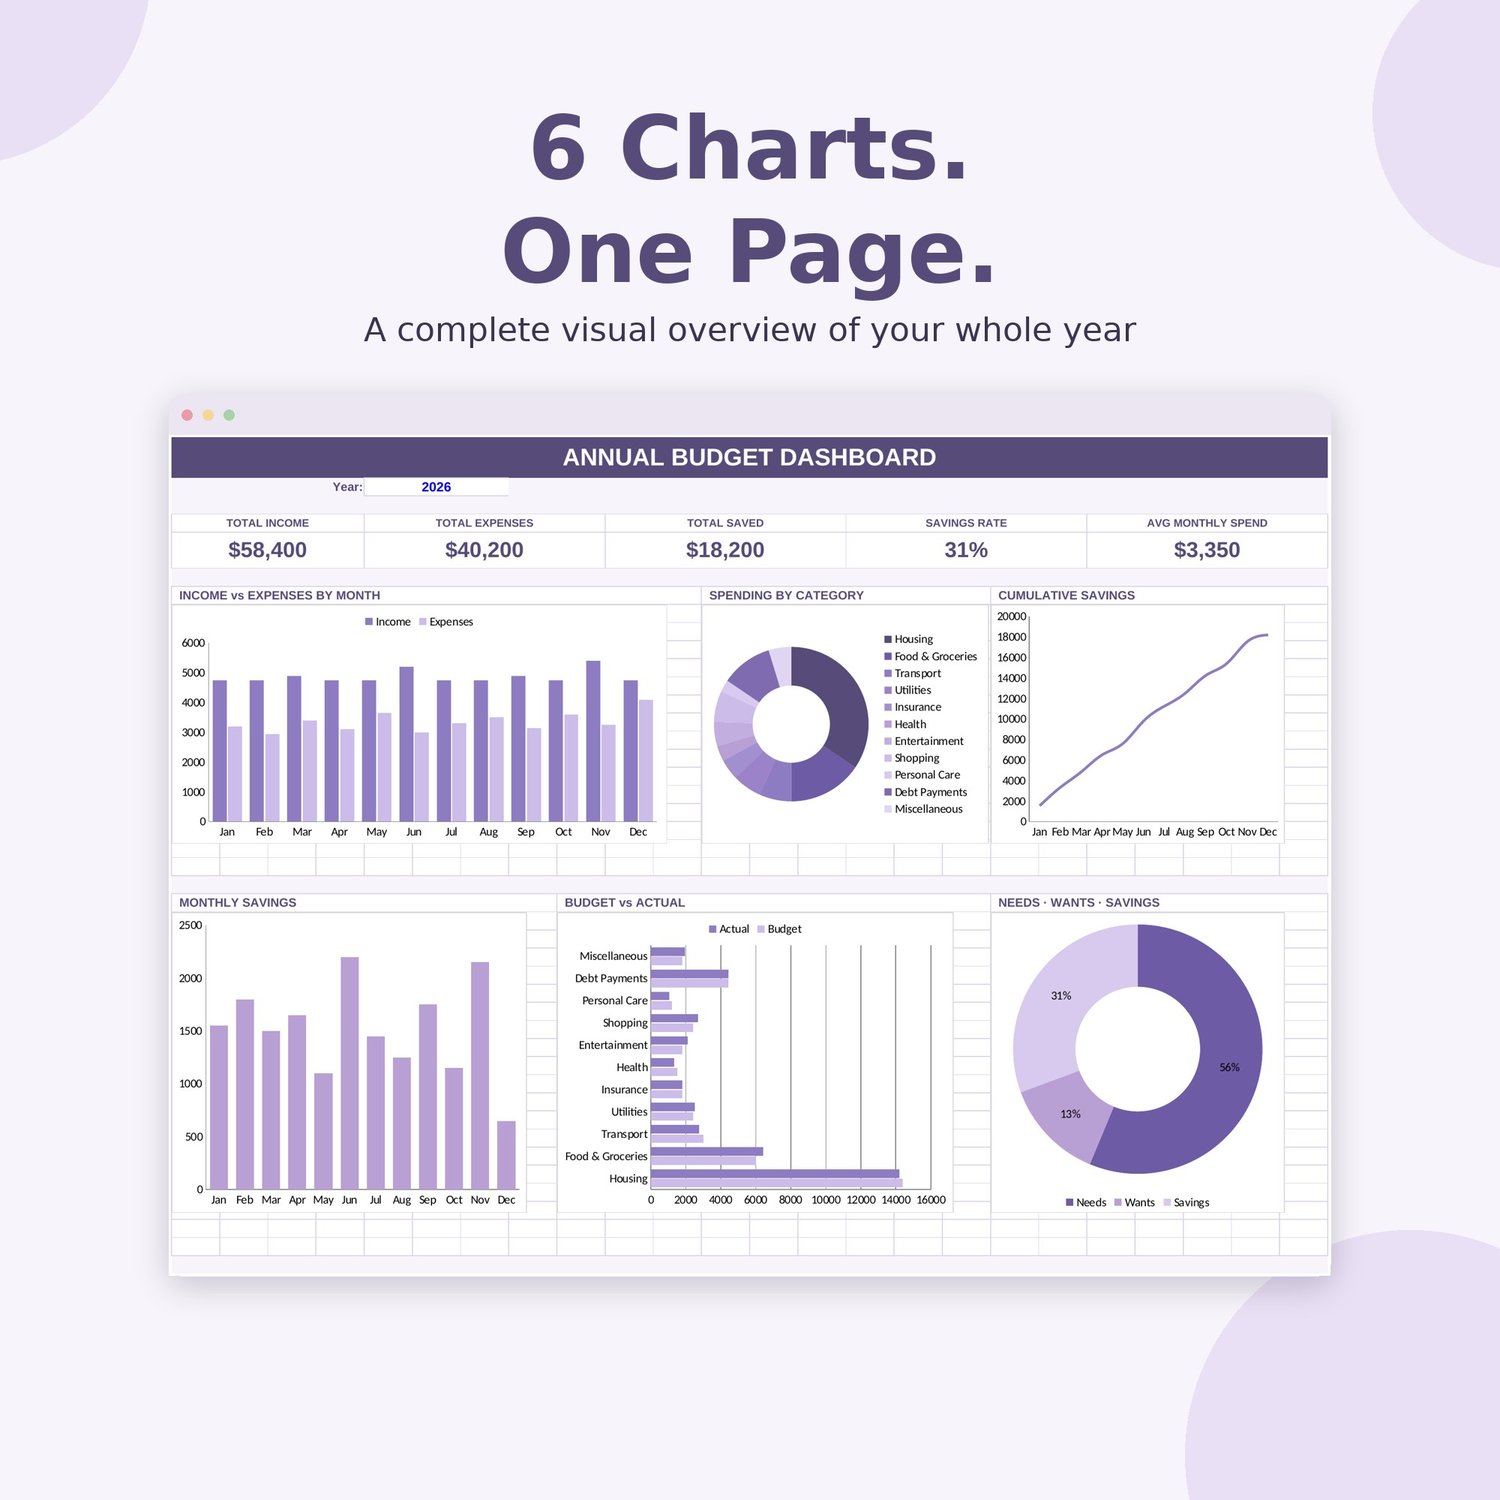
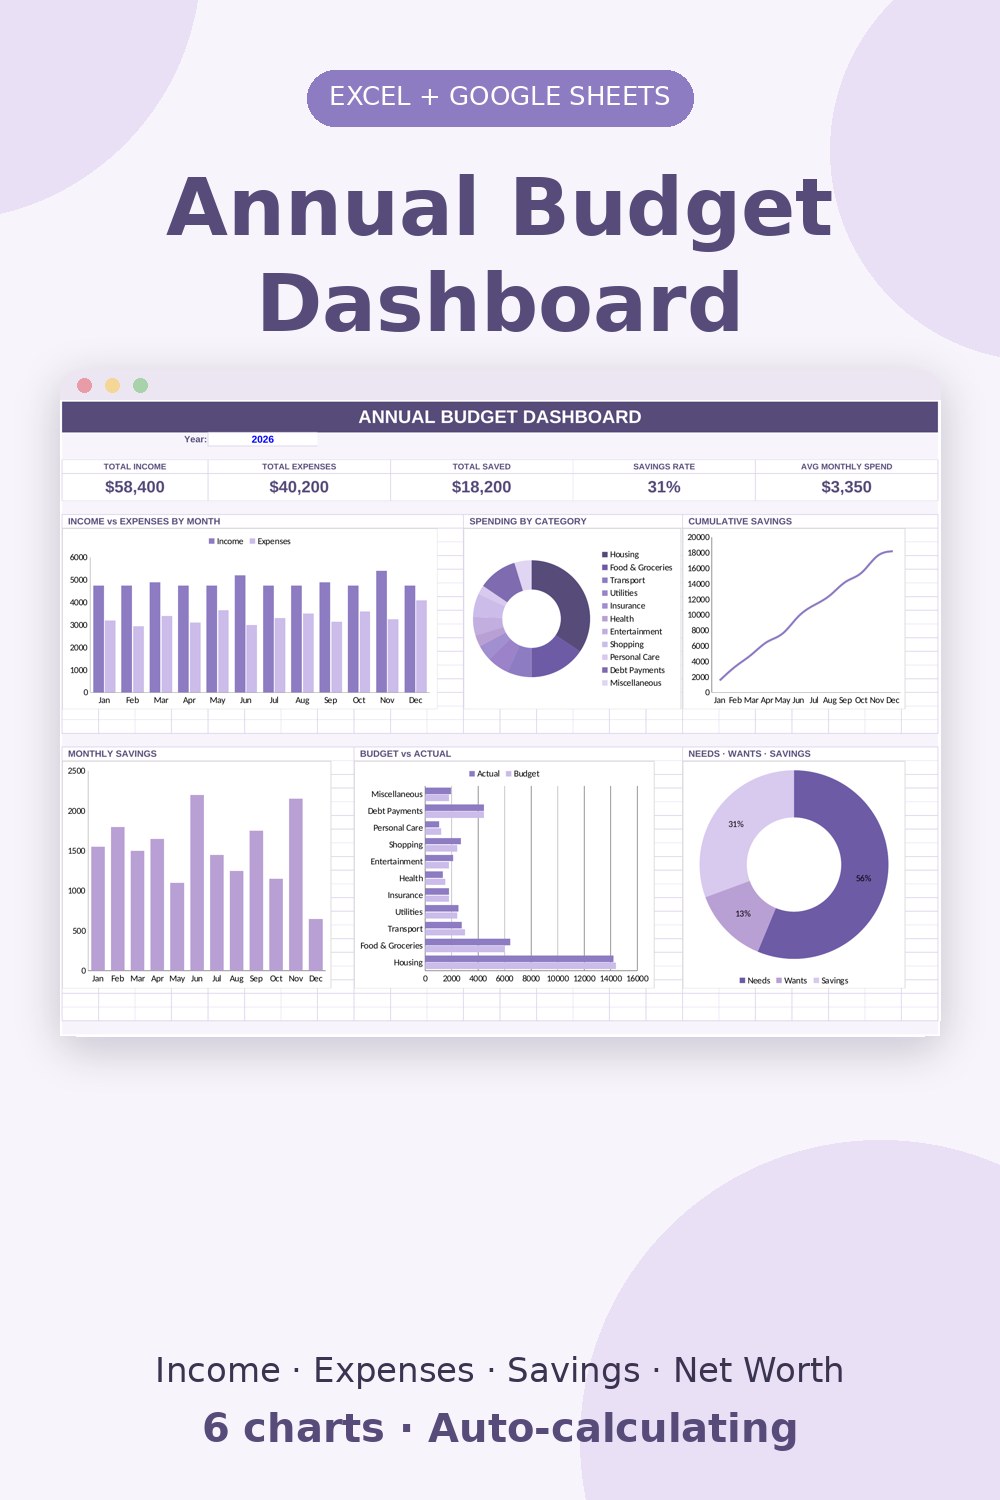
This aesthetic annual budget dashboard turns 12 months of numbers into a clean, color-coded overview. Enter your income and expenses, and six charts — plus key totals — update instantly. No formulas to build, no spreadsheet skills needed.
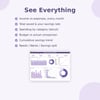
💜 What you'll see on one page:
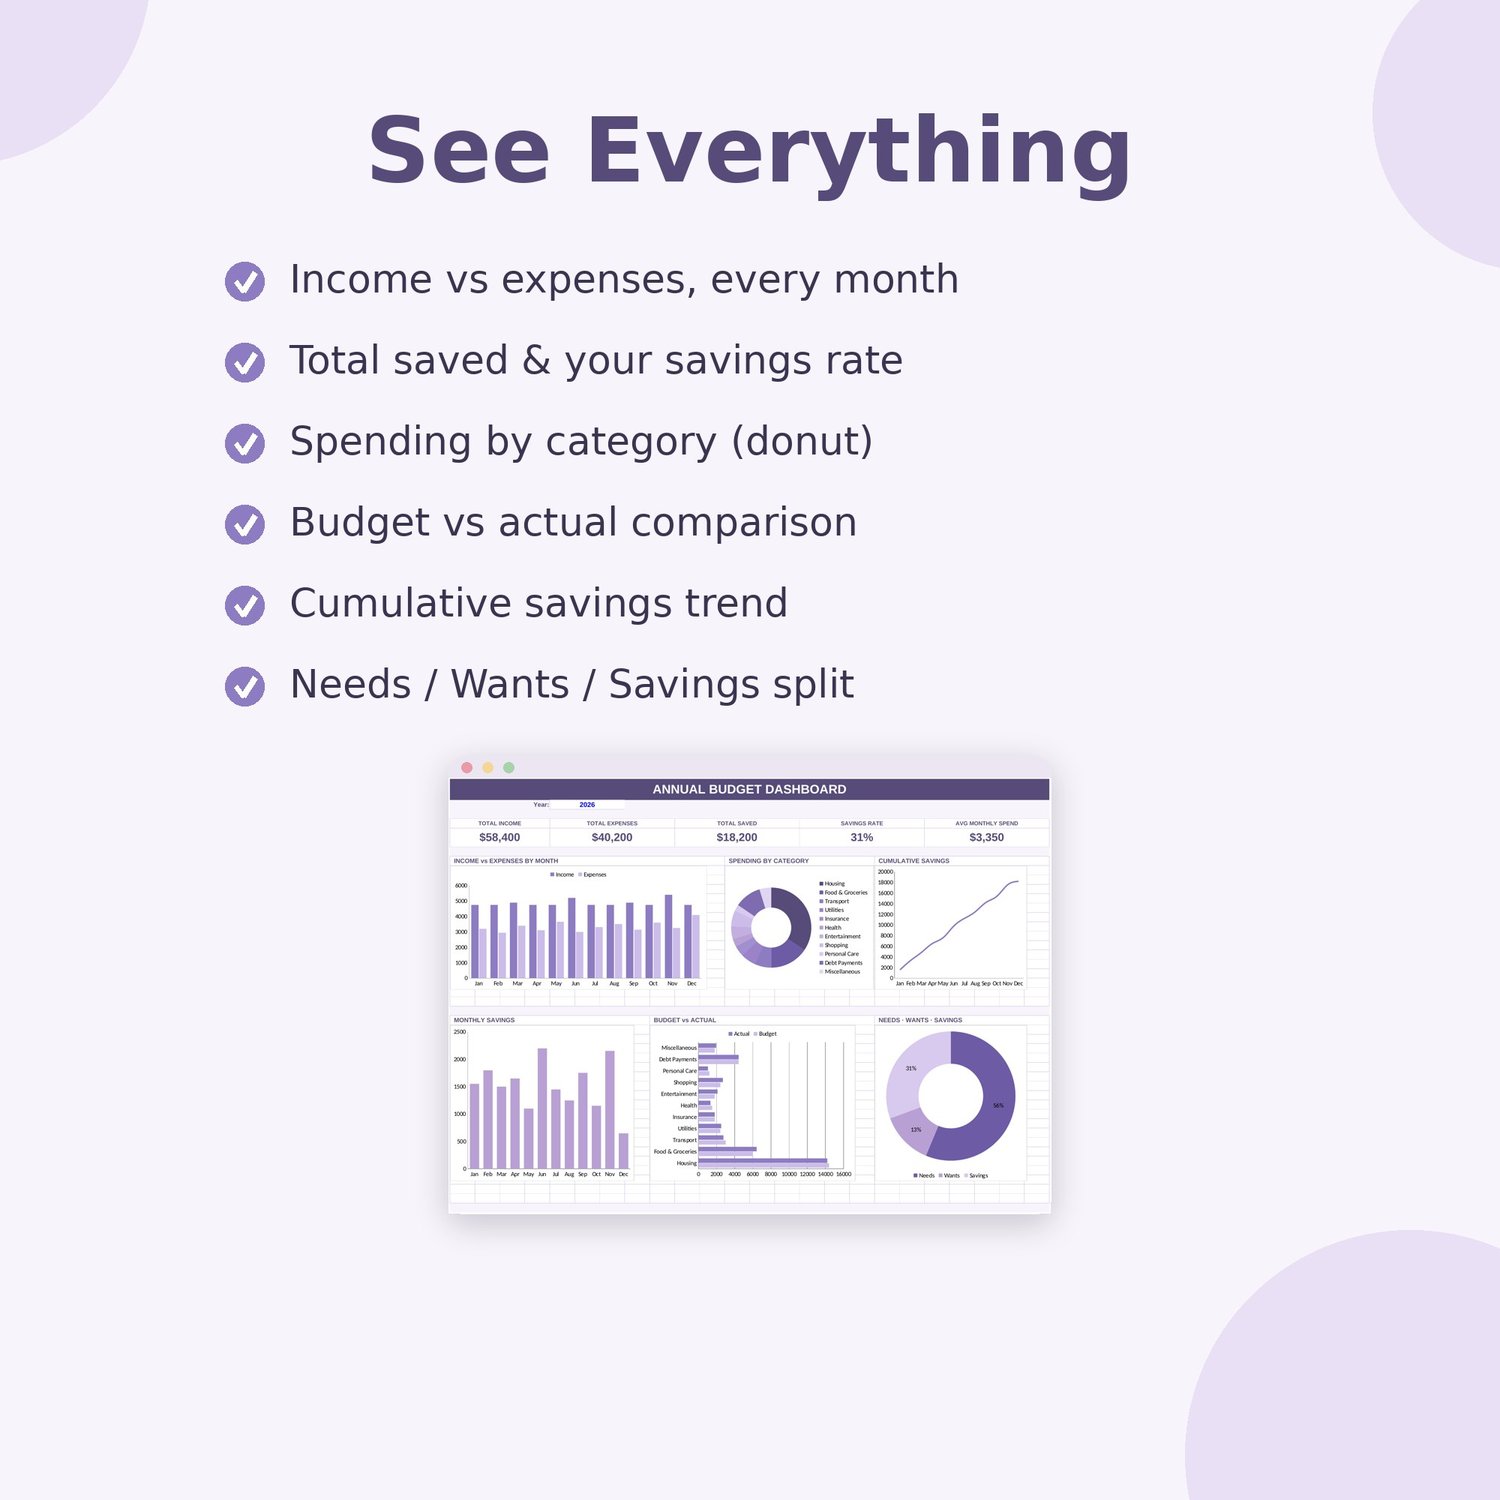
• Total Income, Expenses, Saved & Savings Rate at a glance
• Income vs Expenses for every month (bar chart)
• Spending by category (donut chart)
• Cumulative savings growth (line chart)
• Monthly savings (bar chart)
• Budget vs Actual by category (bar chart)
• Needs / Wants / Savings split (donut chart)
🖊️ How it works:
Type your monthly income, expenses and category budgets on the Annual Data tab — the dashboard does the rest. Only the highlighted cells need editing.
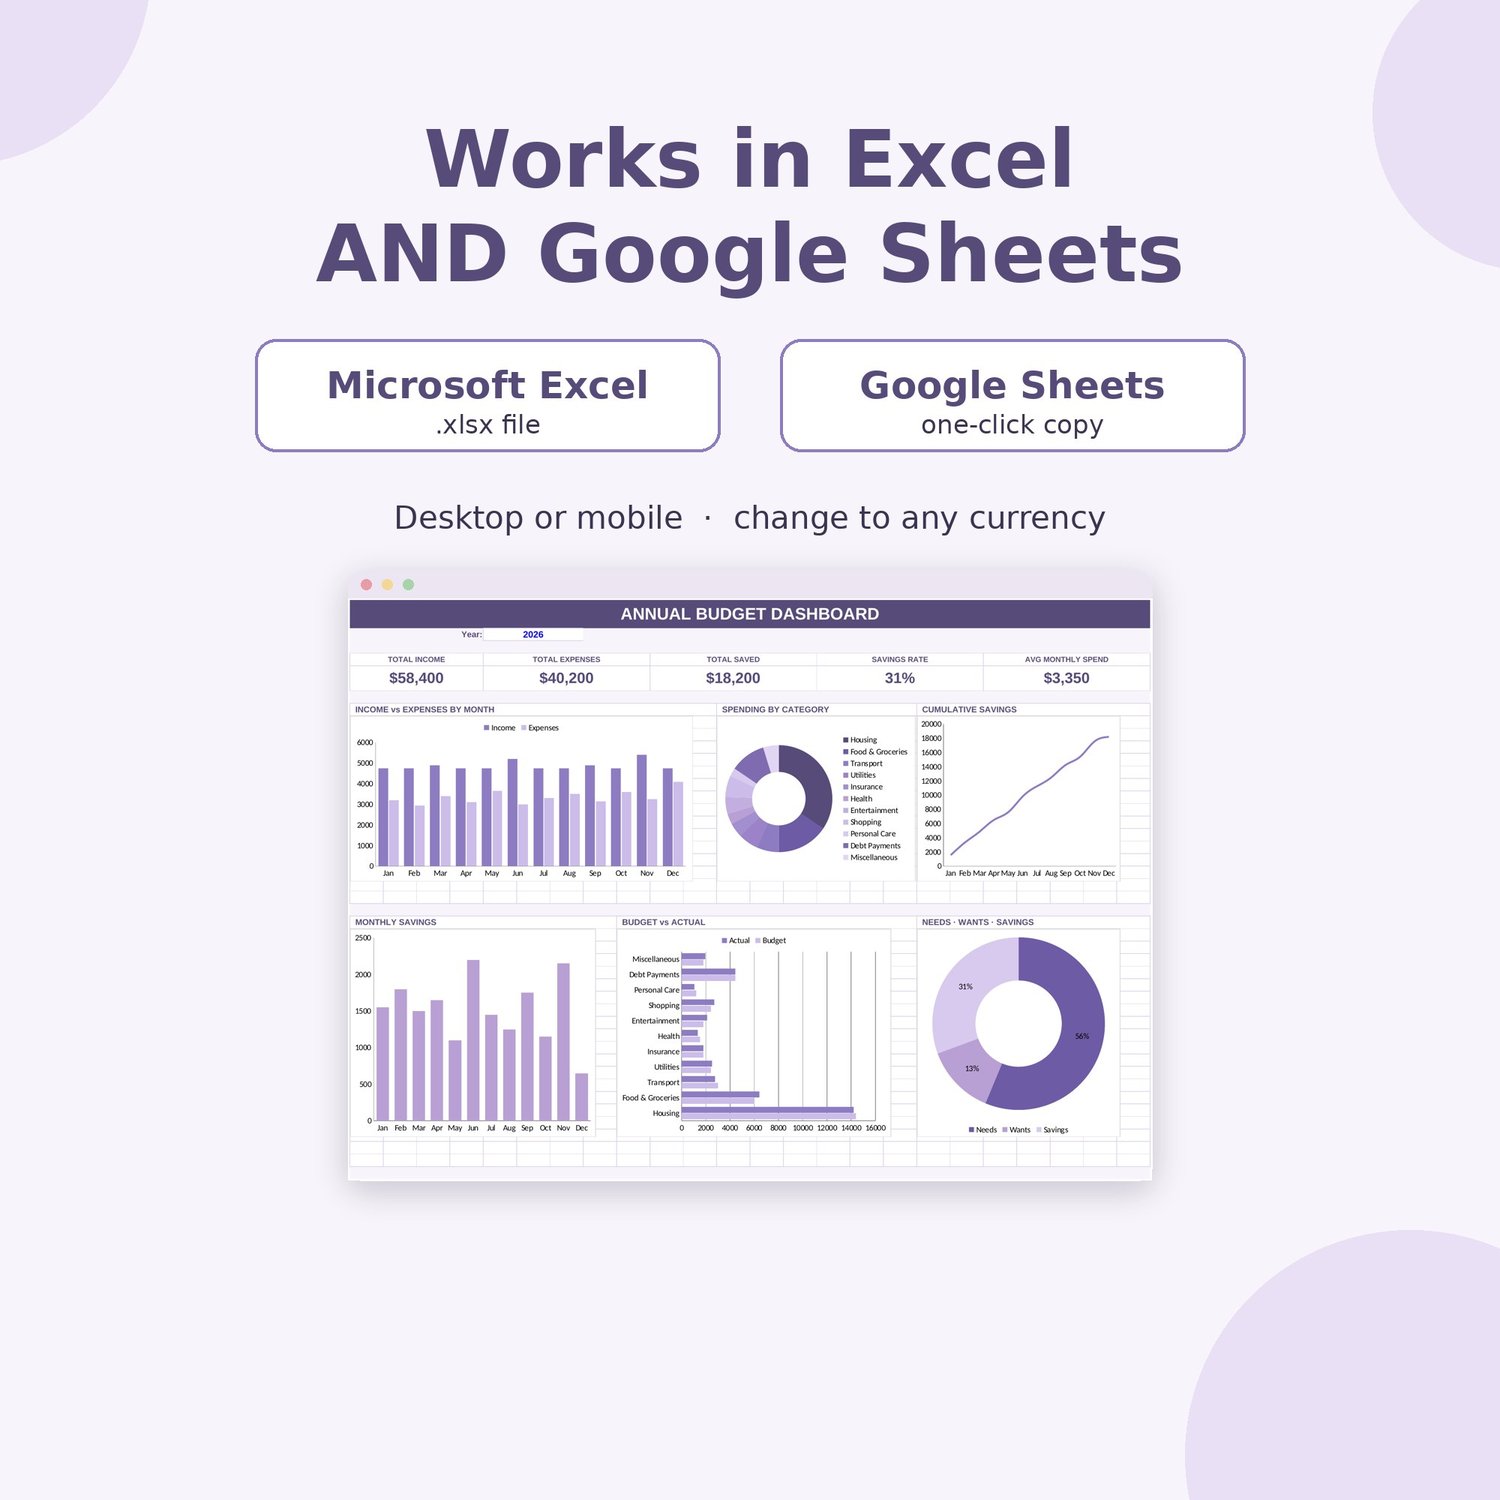
💻 Works in BOTH Microsoft Excel and Google Sheets. Desktop or mobile. Change $ to any currency in seconds. Reusable year after year.
⬇️ Instant digital download — see your full financial year today.