


Ranges & Consolidation Explained — Measured (PDF Guide)
Range strategies look wonderful on the examples and lose money on your screen. The reason is not execution. It is that the examples are all drawn from one kind of sideways market and your screen keeps showing you the other kind, and nobody has ever given you a rule for telling them apart.
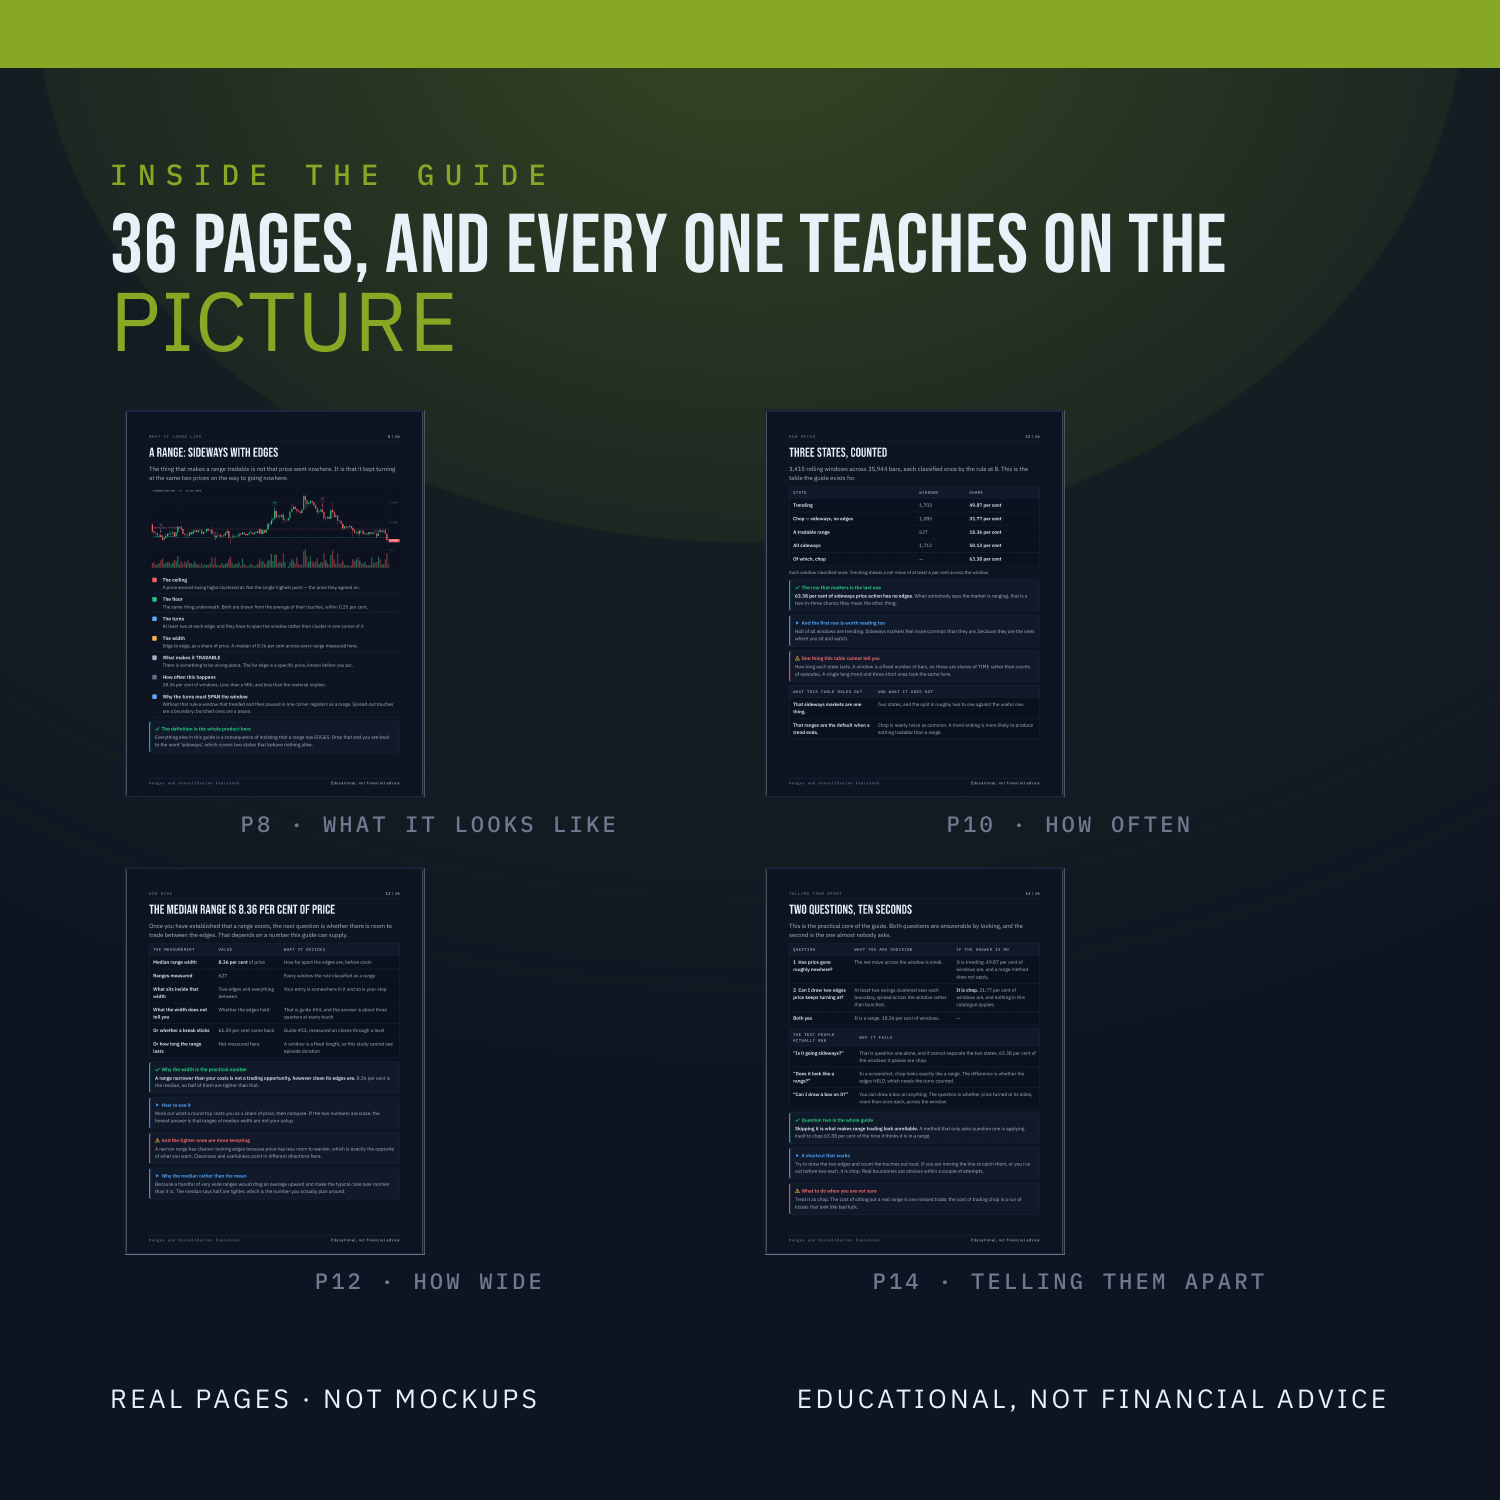
Two definitions, applied to 3,415 windows across 35,944 bars, and counted separately. A range has boundaries that price keeps turning at. Chop goes sideways with no boundaries at all. They are different states, they are counted here for the first time, and the second is more common than the first. This is a 36-page PDF that teaches Ranges & Consolidation from the first thing you see on the screen through to a written strategy with an entry, a stop and an explicit rule for when the trade is wrong.
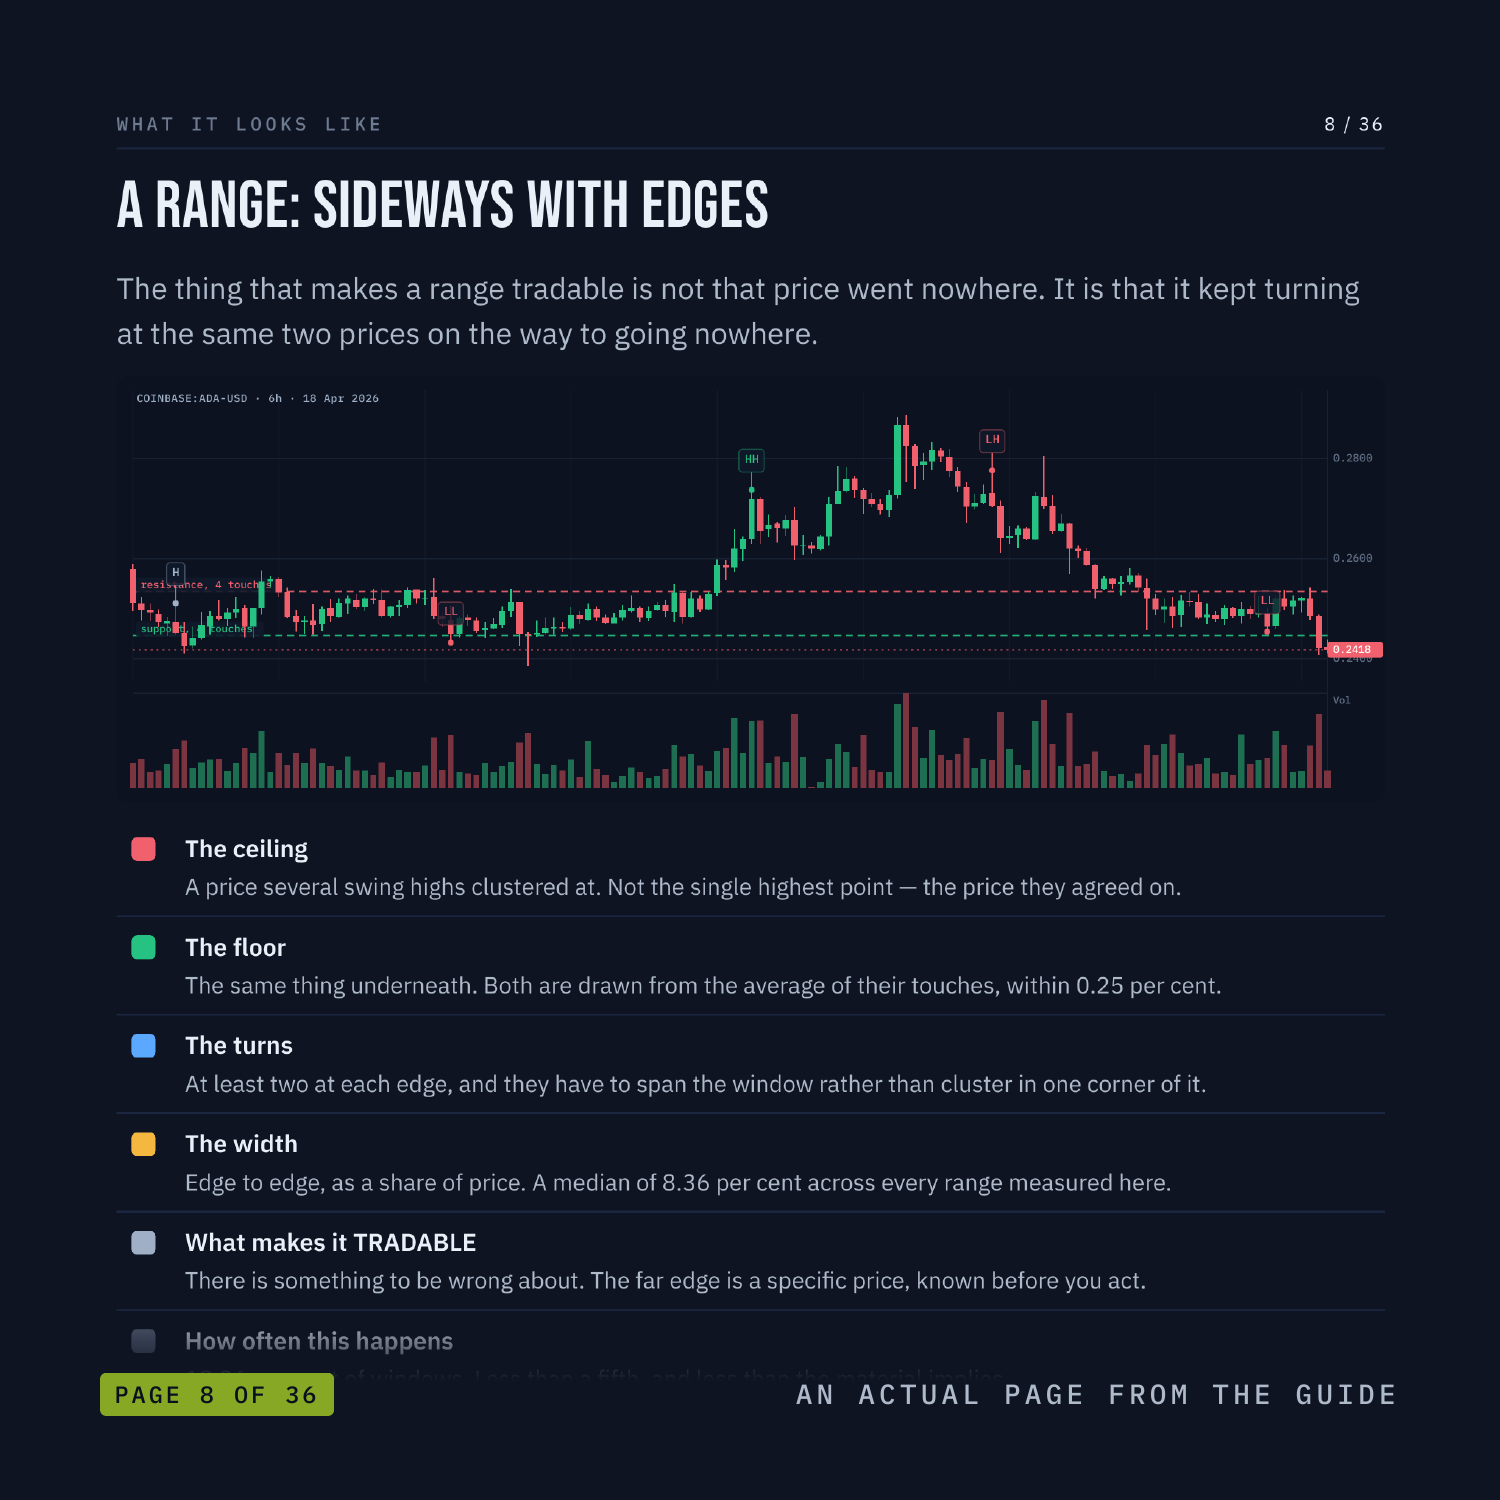
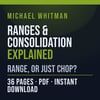
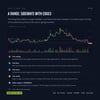
Nothing is taught underneath a chart. Every label sits on the candle, the line or the level it is describing, on real BTC, ETH, SOL and LINK charts. There are three quizzes on real charts, each followed by the same chart re-shown annotated with the reasoning, plus faded practice pages where the first steps are filled in and you finish the rest.
WHAT'S INSIDE
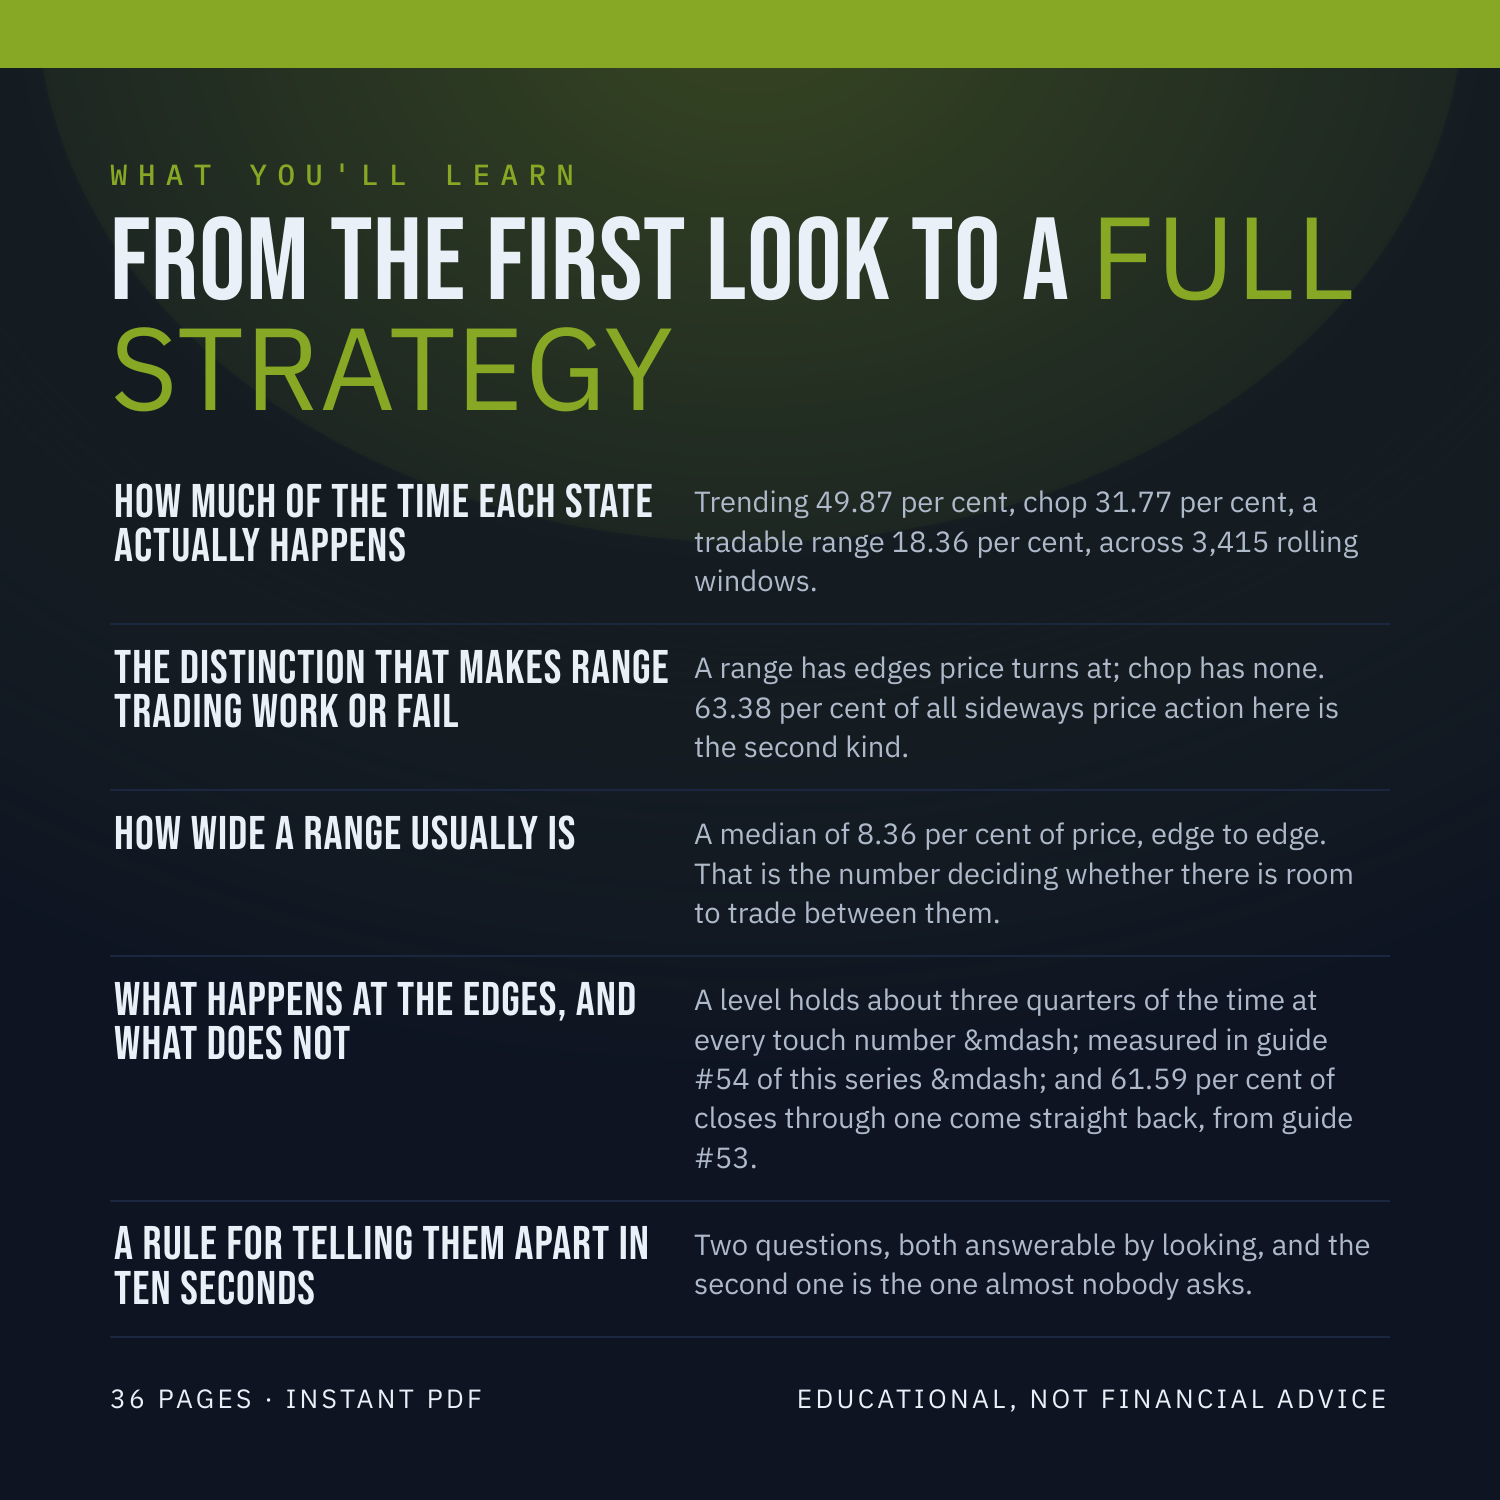
How much of the time each state actually happens - Trending 49.87 per cent, chop 31.77 per cent, a tradable range 18.36 per cent, across 3,415 rolling windows.
The distinction that makes range trading work or fail - A range has edges price turns at; chop has none. 63.38 per cent of all sideways price action here is the second kind.
How wide a range usually is - A median of 8.36 per cent of price, edge to edge. That is the number deciding whether there is room to trade between them.
What happens at the edges, and what does not - A level holds about three quarters of the time at every touch number, measured in guide #54 of this series, and 61.59 per cent of closes through one come straight back, from guide #53.
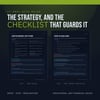
A rule for telling them apart in ten seconds - Two questions, both answerable by looking, and the second one is the one almost nobody asks.
WHAT YOU'LL BE ABLE TO DO
Tell a range from chop by a written rule, not by feel.
Say how often each state actually occurs.
Judge whether a range is wide enough to be worth trading.
Recognise the state where no strategy in this catalogue applies.
Read 'the market is ranging' as a claim that needs checking.
AN HONEST NOTE
A range is a clue, not a crystal ball. It describes what price has already done. This guide contains no win-rates, no backtest results and no promises about what you will make, because nobody can verify those and you should not trust anyone who prints them. What it hands you instead is a set of rules you can test yourself on TradingView in an afternoon. Educational, not financial advice.
Instant download. 36 pages, PDF.