



Chart Timeframes Explained
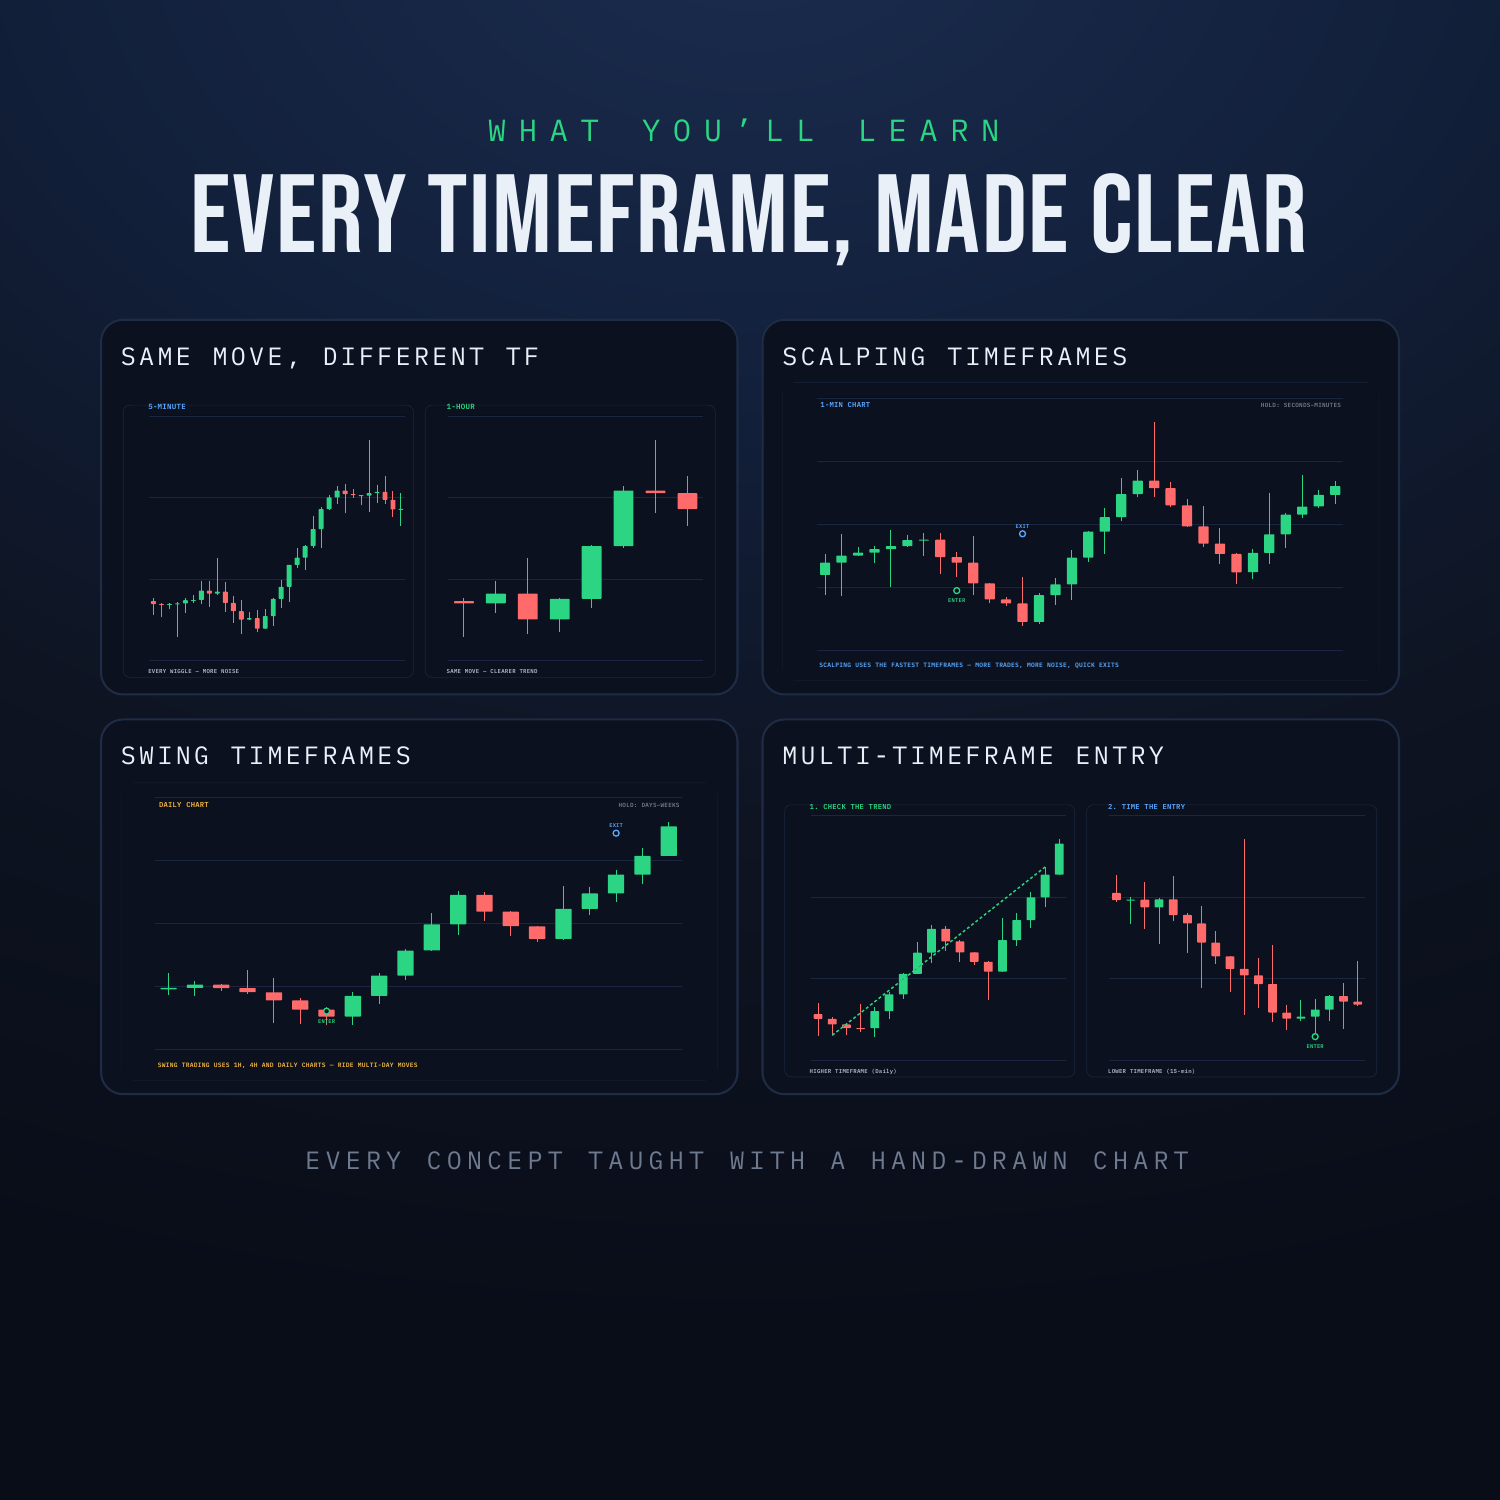
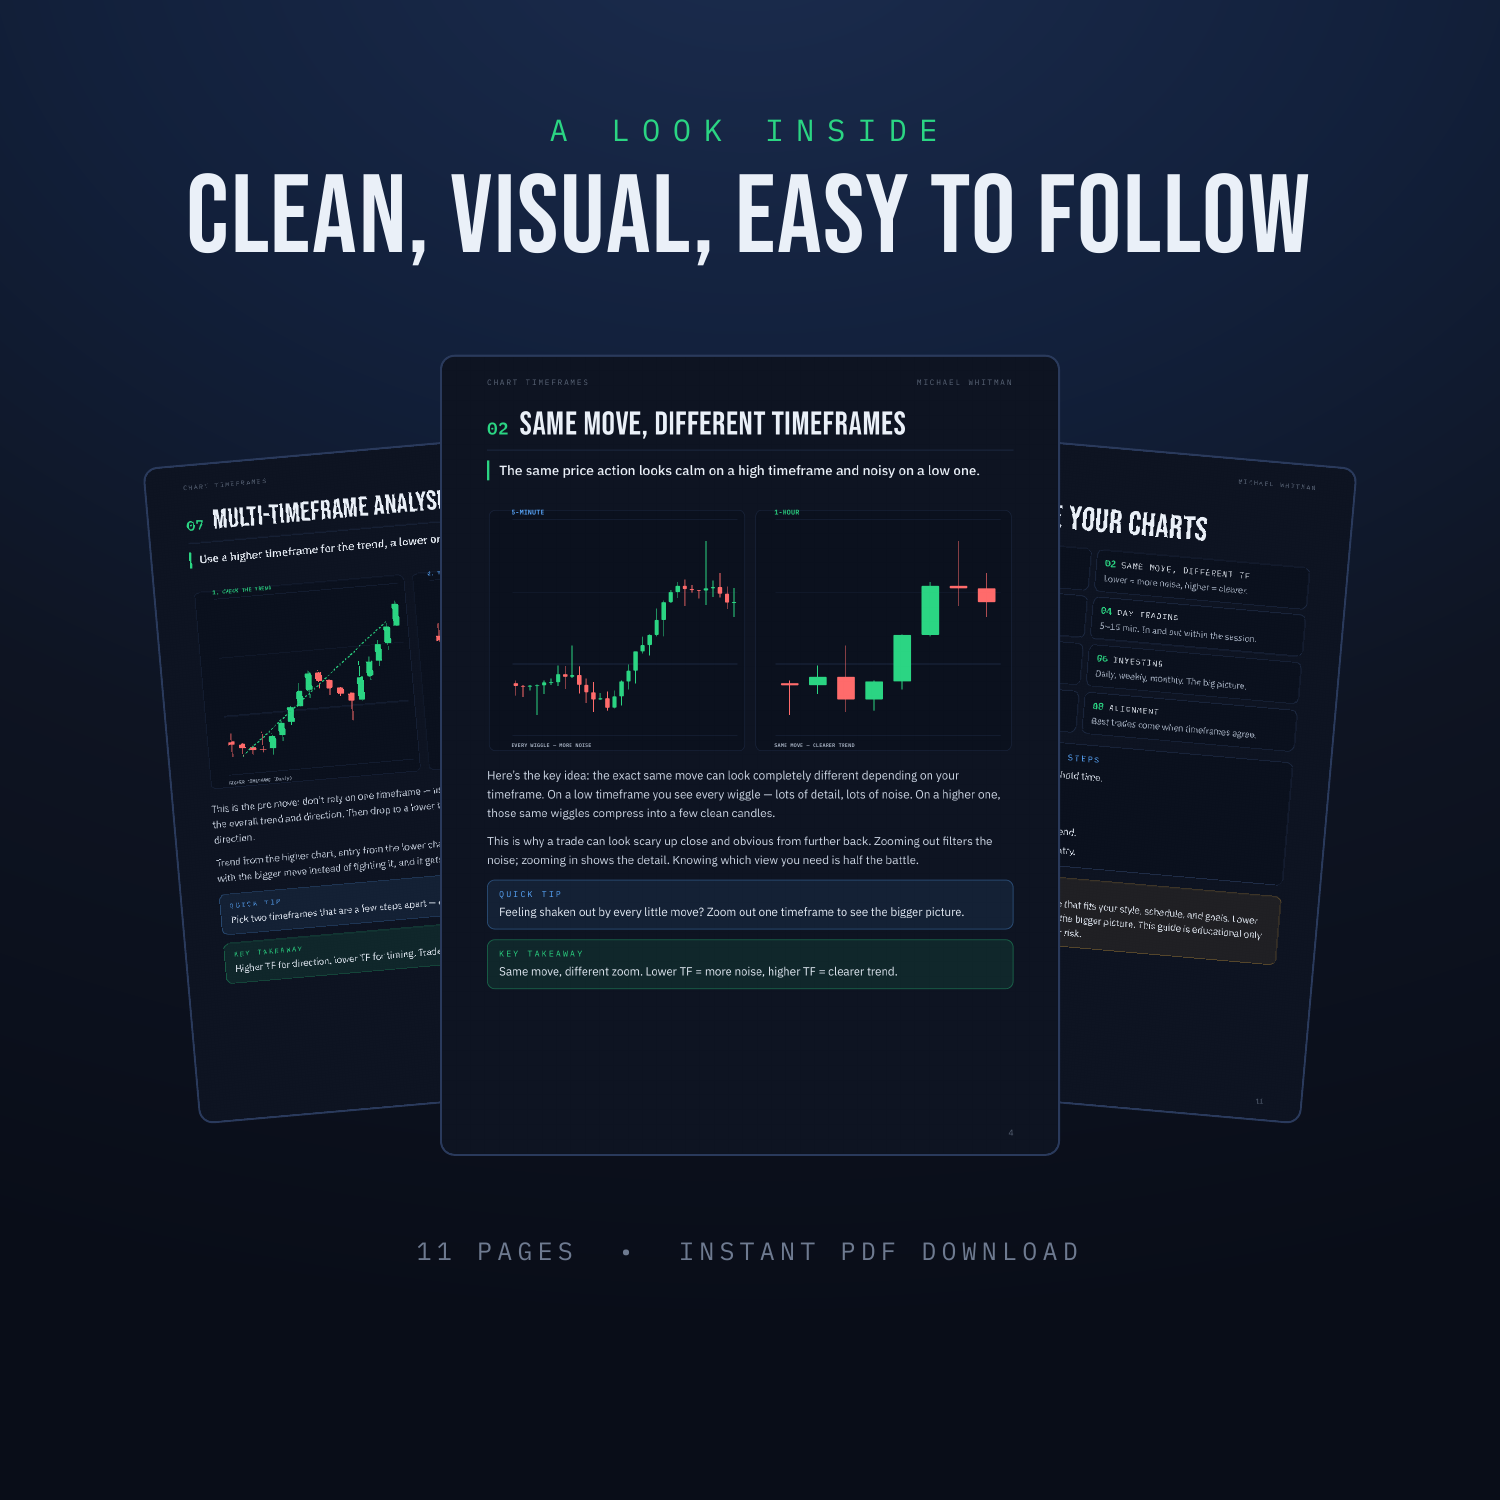
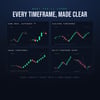
Two traders look at the same chart and see completely different things — one sees a clean trend, the other sees chaos. The difference is the timeframe. Pick the wrong one for your style and even a good strategy falls apart. This visual, no-fluff guide makes timeframes simple. It shows you exactly which chart to watch for scalping, day trading, swing trading, and investing — and how the pros combine two timeframes to time better entries. WHAT'S INSIDE - What a Timeframe Is — how much time one candle holds - Same Move, Different Timeframes — why the same move looks different - Scalping Timeframes — 1-min and below, fast and noisy - Day Trading Timeframes — the 5–15 min sweet spot - Swing Trading Timeframes — 1H, 4H, daily - Investing Timeframes — daily, weekly, monthly - Multi-Timeframe Analysis — trend up high, entry down low - Timeframe Alignment — your best trades come when they agree WHAT YOU'LL BE ABLE TO DO - Pick the right timeframe for your trading style - Filter out noise by zooming out to the bigger picture - Use the pro "top-down" method to time cleaner entries - Stop getting shaken out of good trades Every concept is taught with a clean, hand-drawn chart — including the same move shown side by side on two timeframes. HONEST NOTE There is no single "best" timeframe — only the one that fits your style, schedule, and goals. This guide is educational only and is not financial advice. Always manage your risk. WHAT YOU GET - An instant-download PDF guide (11 pages) - Yours to keep and re-read anytime Works hand in hand with every indicator-settings guide — the right settings depend on the timeframe you trade.