


Bull vs Bear Markets Explained for Beginners (PDF)
You keep hearing: trade with the trend, buy the dip in a bull market, never buy the top. You nod along without knowing how anyone decides a market is a bull or a bear, or whether following that label makes a trade any better.
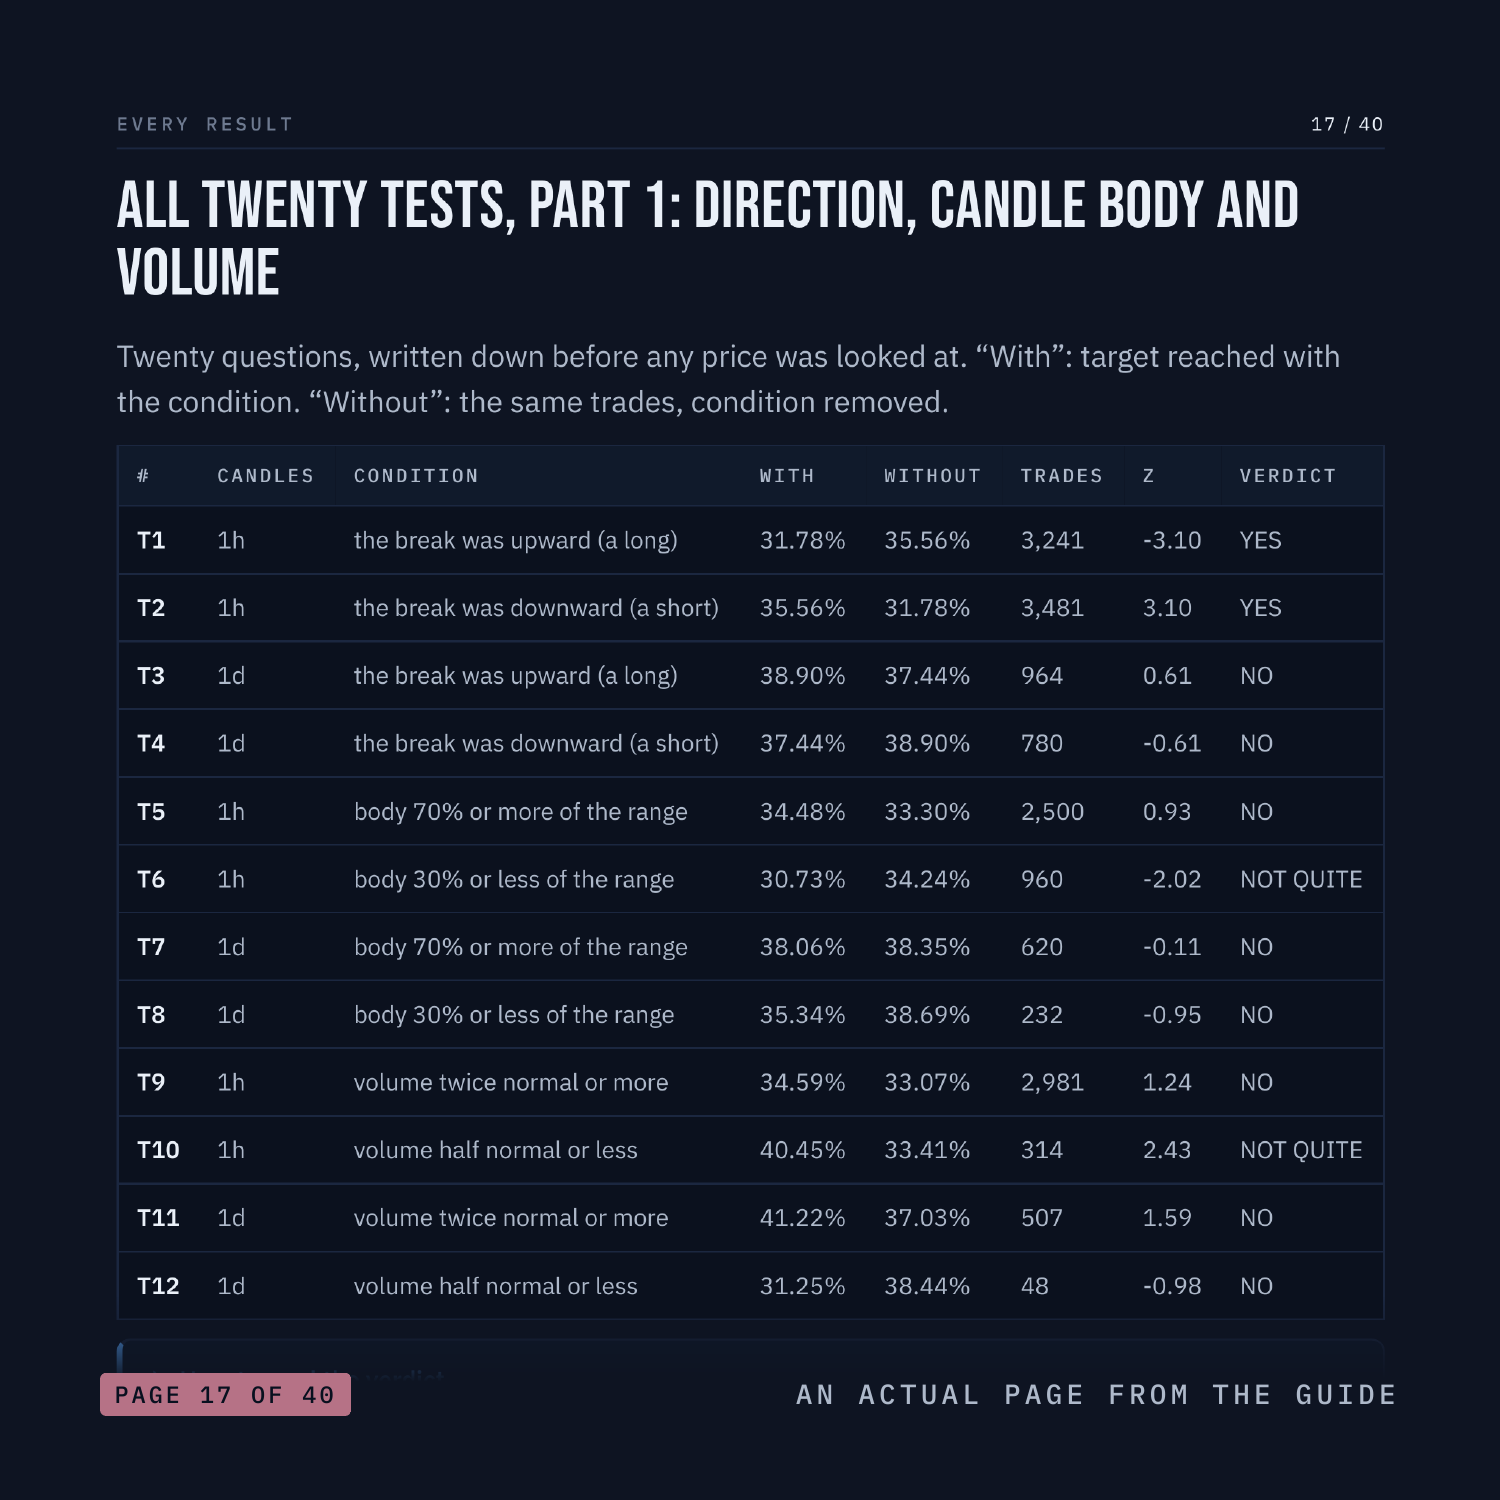
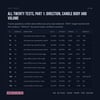
This guide explains bull and bear markets from zero, shows the 200-candle average traders use to label them, and then shows what happened when that label and other popular rules were tested on ten coins, with every result of this wave in one table. It is 40 pages, written for someone who has never traded, with every word explained before it is used.
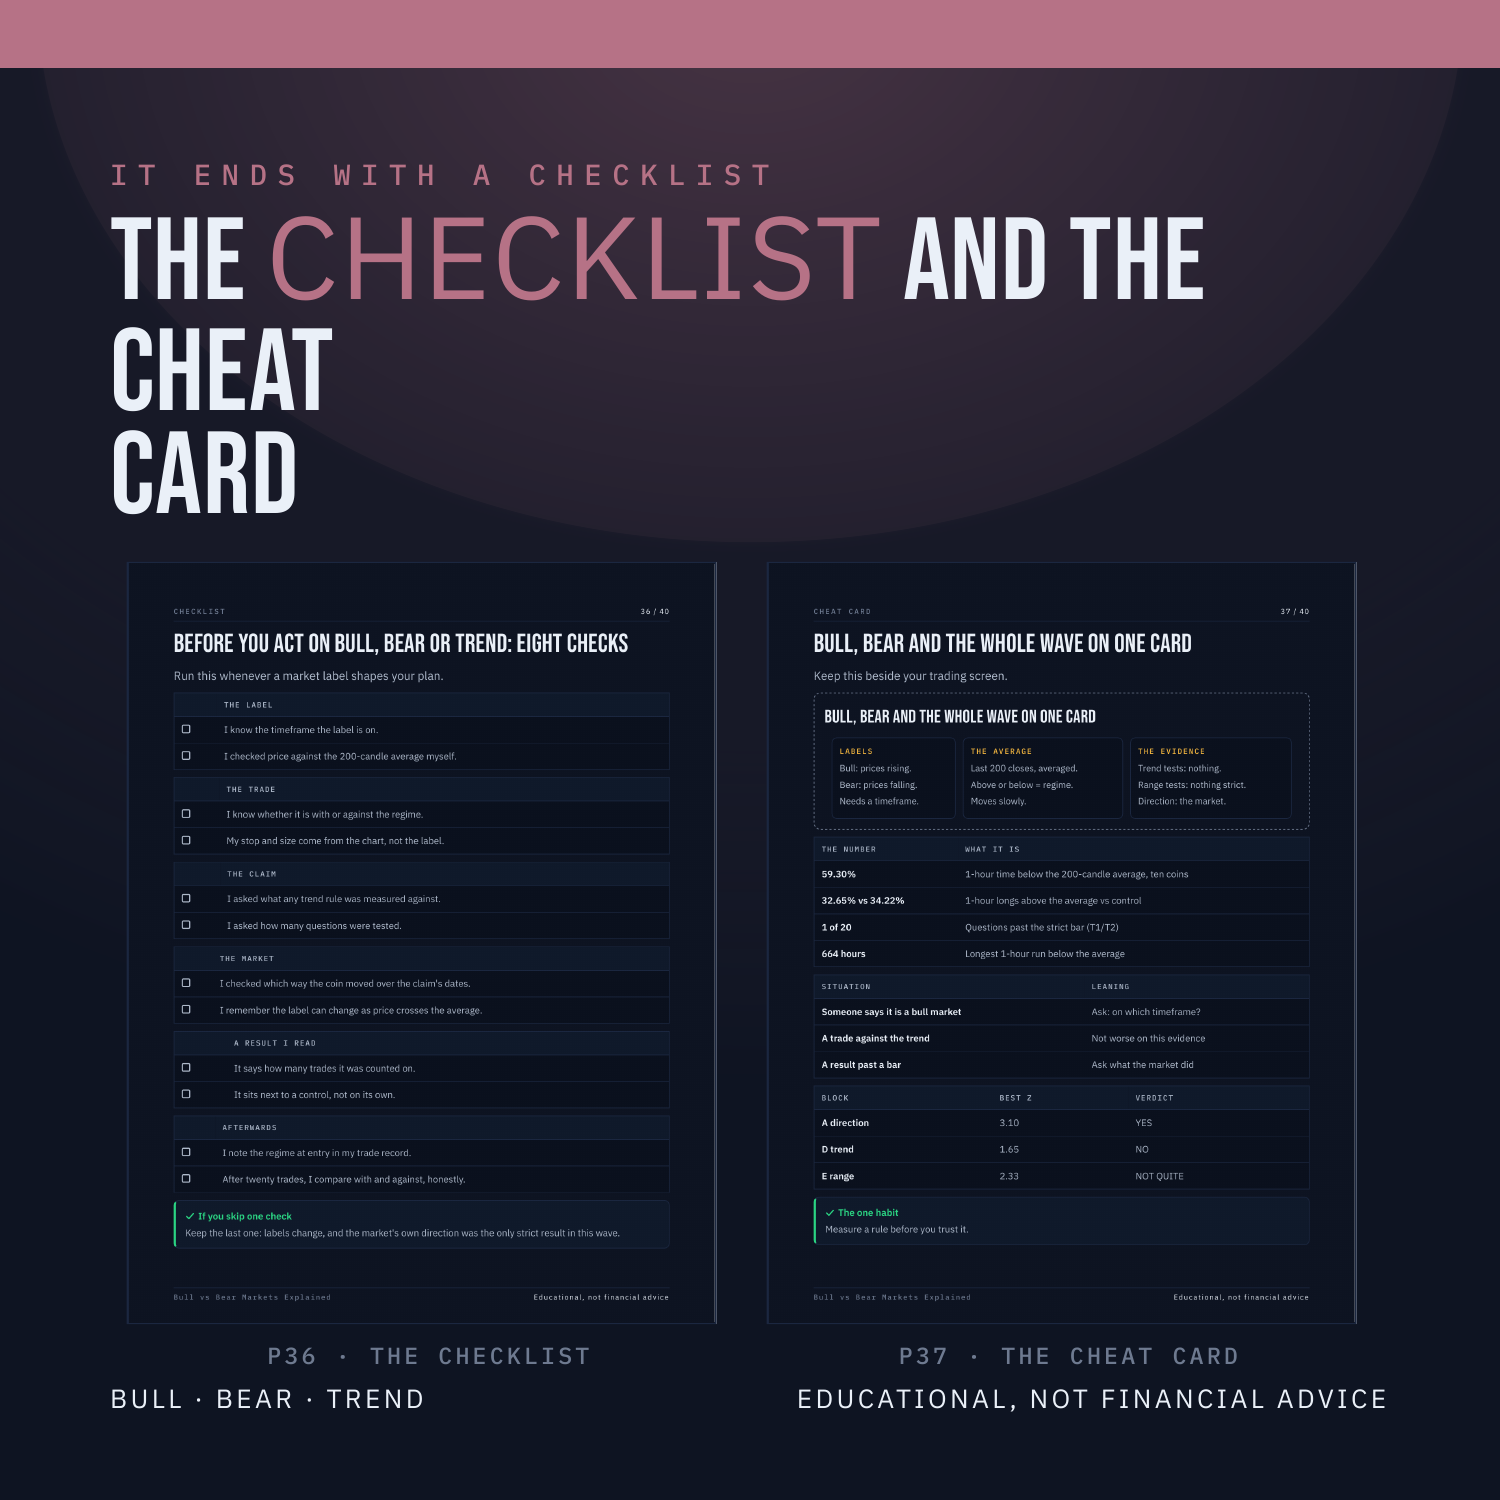
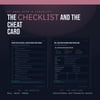
Every idea is drawn with the words on the picture: the two shapes of a bull and a bear market, a moving average worked out with five example closes, and real Dogecoin, XRP and Solana charts with their 200-candle average. Then the measured pages: how much time ten coins spent above and below that average, eight tests of the trend and range rules traders repeat, every one of the twenty tests in this wave in one table, the prediction written before measuring, and the two errors the wave caught in itself. You read the regime on real trades, and it ends with a checklist.
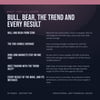
WHAT'S INSIDE
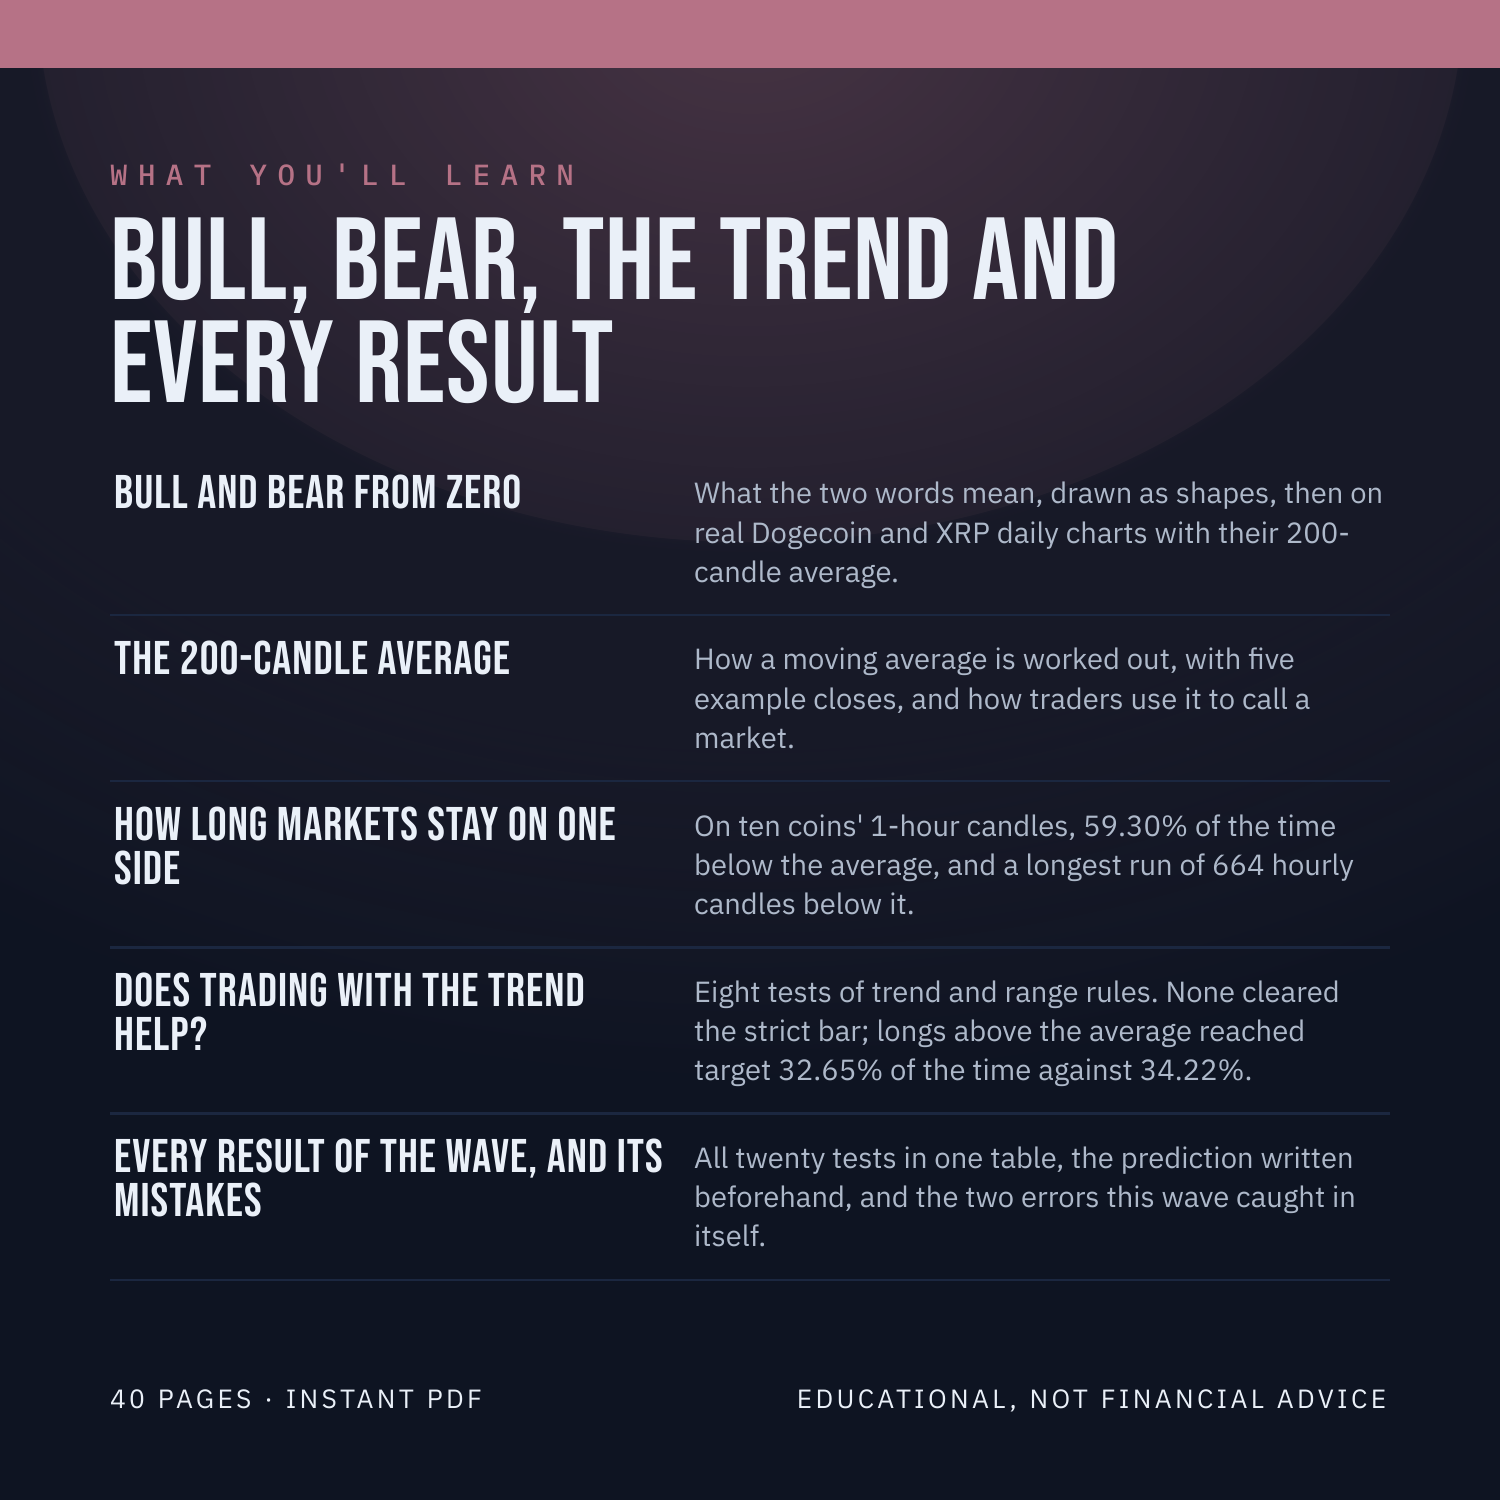
- Bull and bear from zero: What the two words mean, drawn as shapes, then on real Dogecoin and XRP daily charts with their 200-candle average.
- The 200-candle average: How a moving average is worked out, with five example closes, and how traders use it to call a market.
- How long markets stay on one side: On ten coins' 1-hour candles, 59.30% of the time below the average, and a longest run of 664 hourly candles below it.
- Does trading with the trend help?: Eight tests of trend and range rules. None cleared the strict bar; longs above the average reached target 32.65% of the time against 34.22%.
- Every result of the wave, and its mistakes: All twenty tests in one table, the prediction written beforehand, and the two errors this wave caught in itself.
WHAT YOU'LL BE ABLE TO DO
- Explain what makes a market a bull or a bear market.
- Read the 200-candle average and say which side price is on.
- Say whether a trade is with or against that label.
- Read a table of test results and pick out what is and is not a finding.
AN HONEST NOTE
No guide can tell you whether the market will rise or fall, and this one does not try. None of the trend or range tests cleared the strict bar; the only strict result in the wave was the drift of a falling year, and the guide says so. Shapes and round numbers are examples; dated charts are real. No win rates to follow, no profit figures, no promises. Educational, not financial advice.
Instant PDF download.