
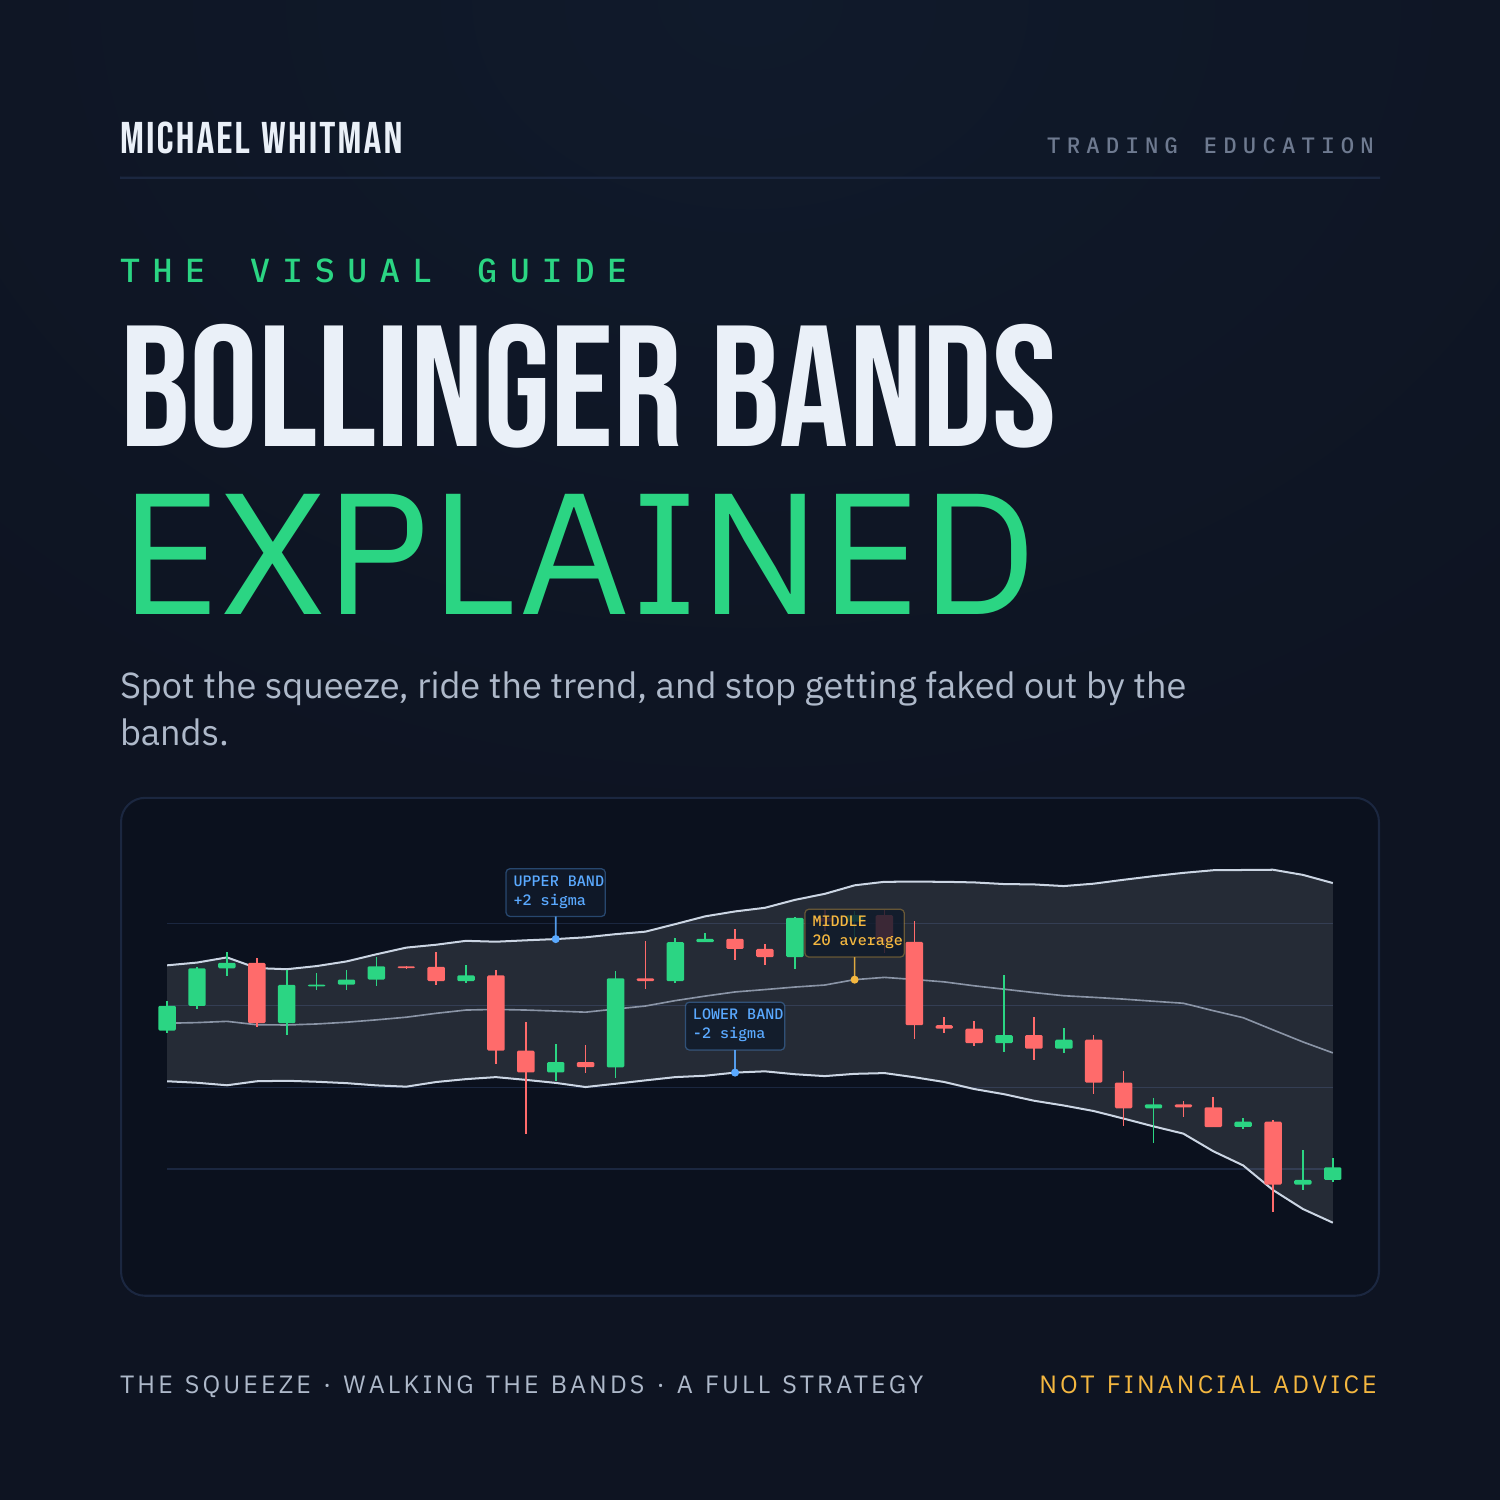
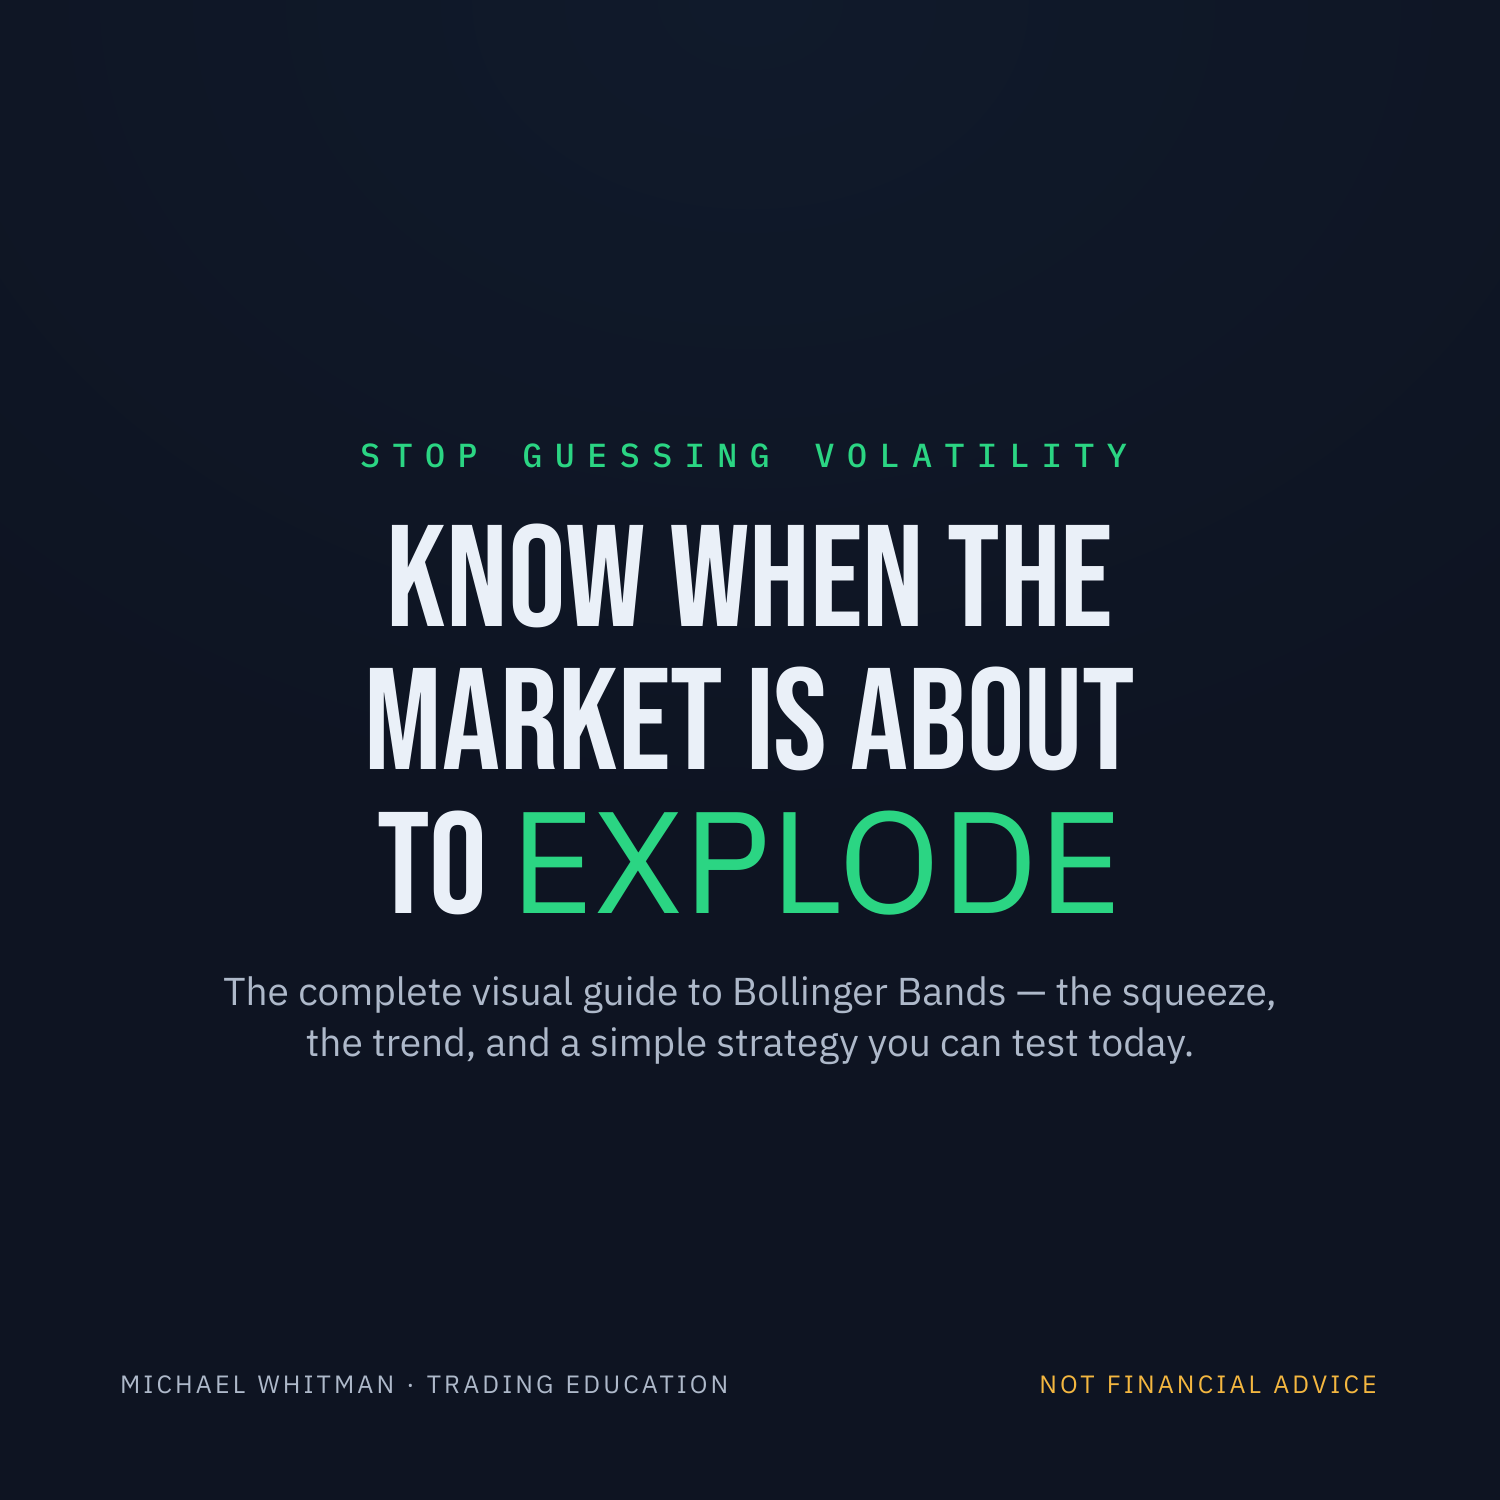



Bollinger Bands Explained — Squeeze, Trends & a Simple Strategy
On Sale
$7.00
$7.00
Most traders use Bollinger Bands backwards — they buy the lower band and sell the upper band, then get run over the moment a real trend shows up.
This visual guide fixes that.
📘 What It Is
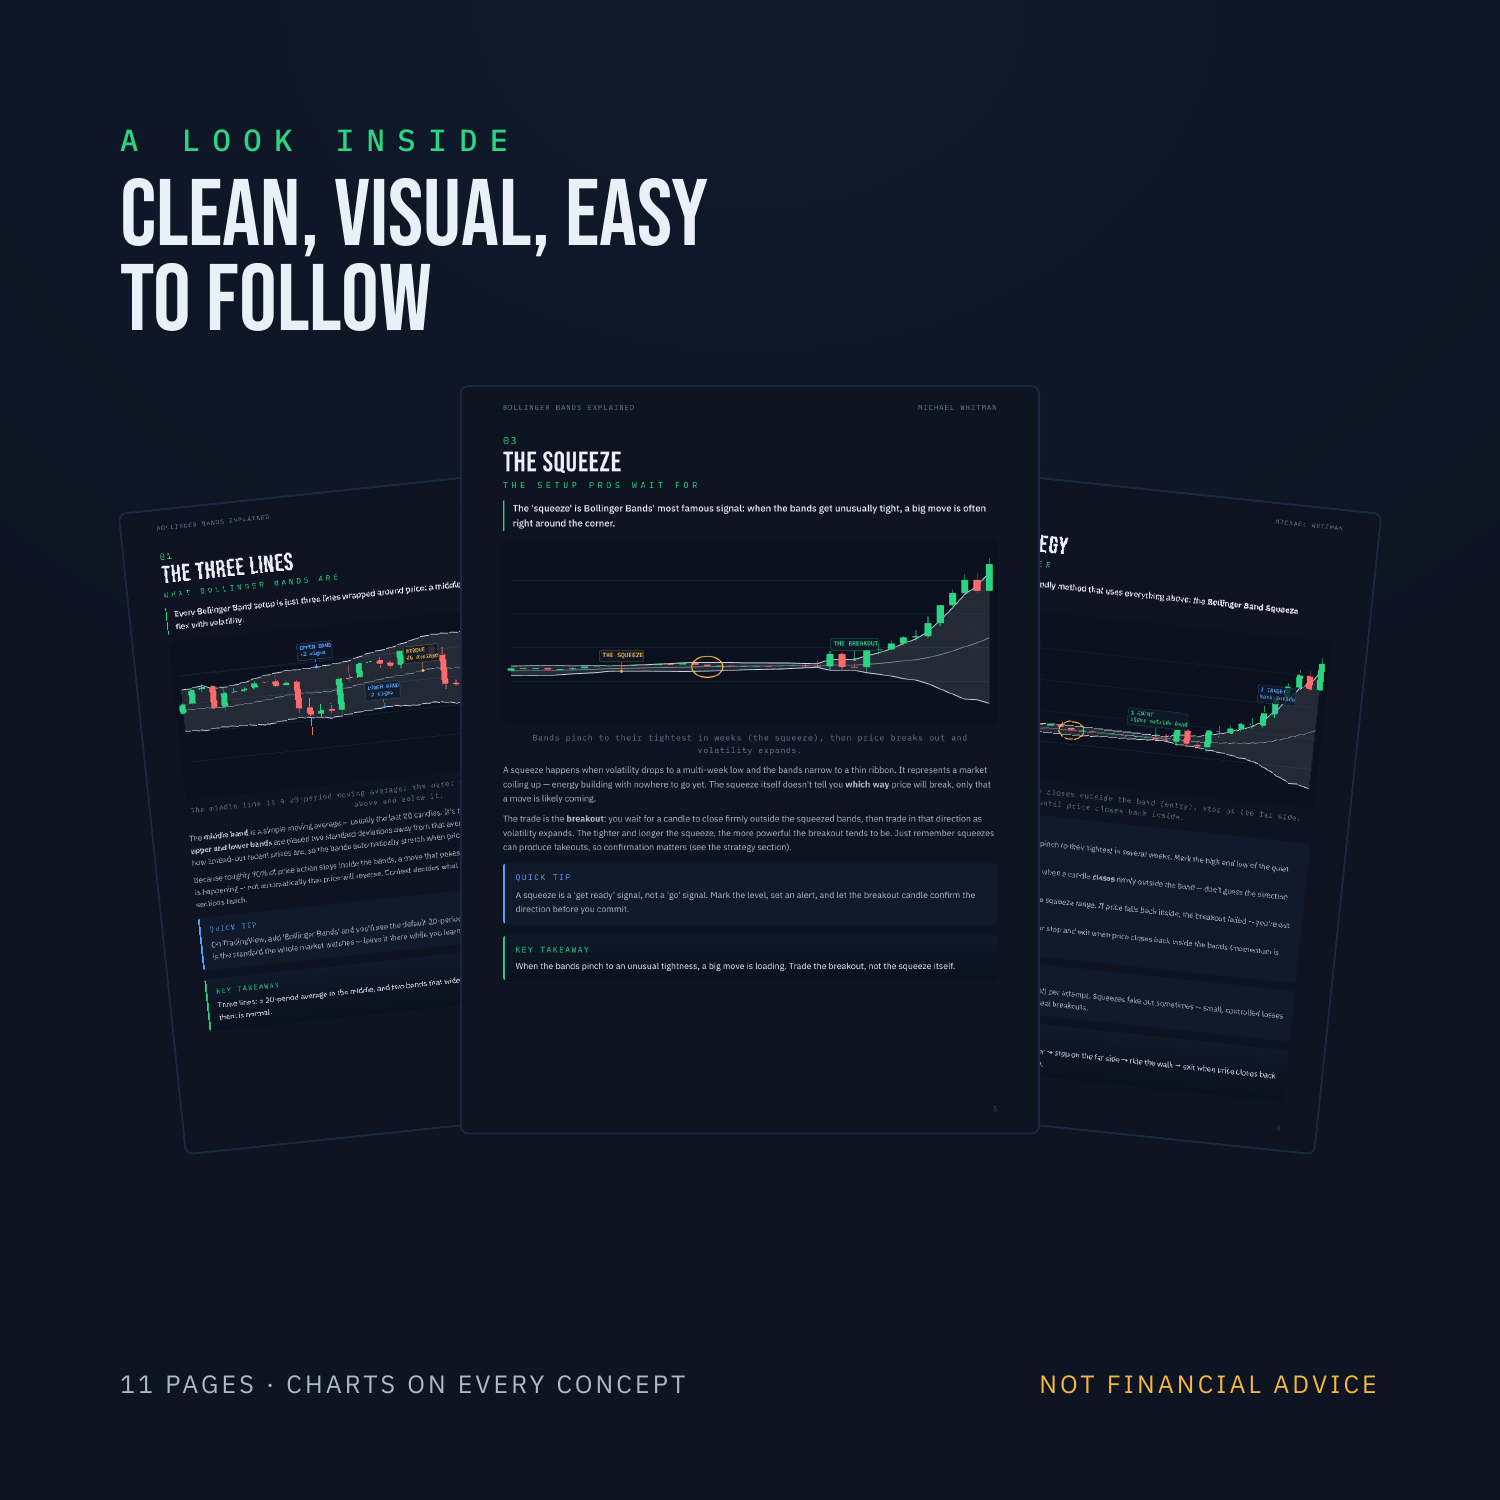
Bollinger Bands Explained — a clean, beginner-friendly PDF that teaches the indicator visually.
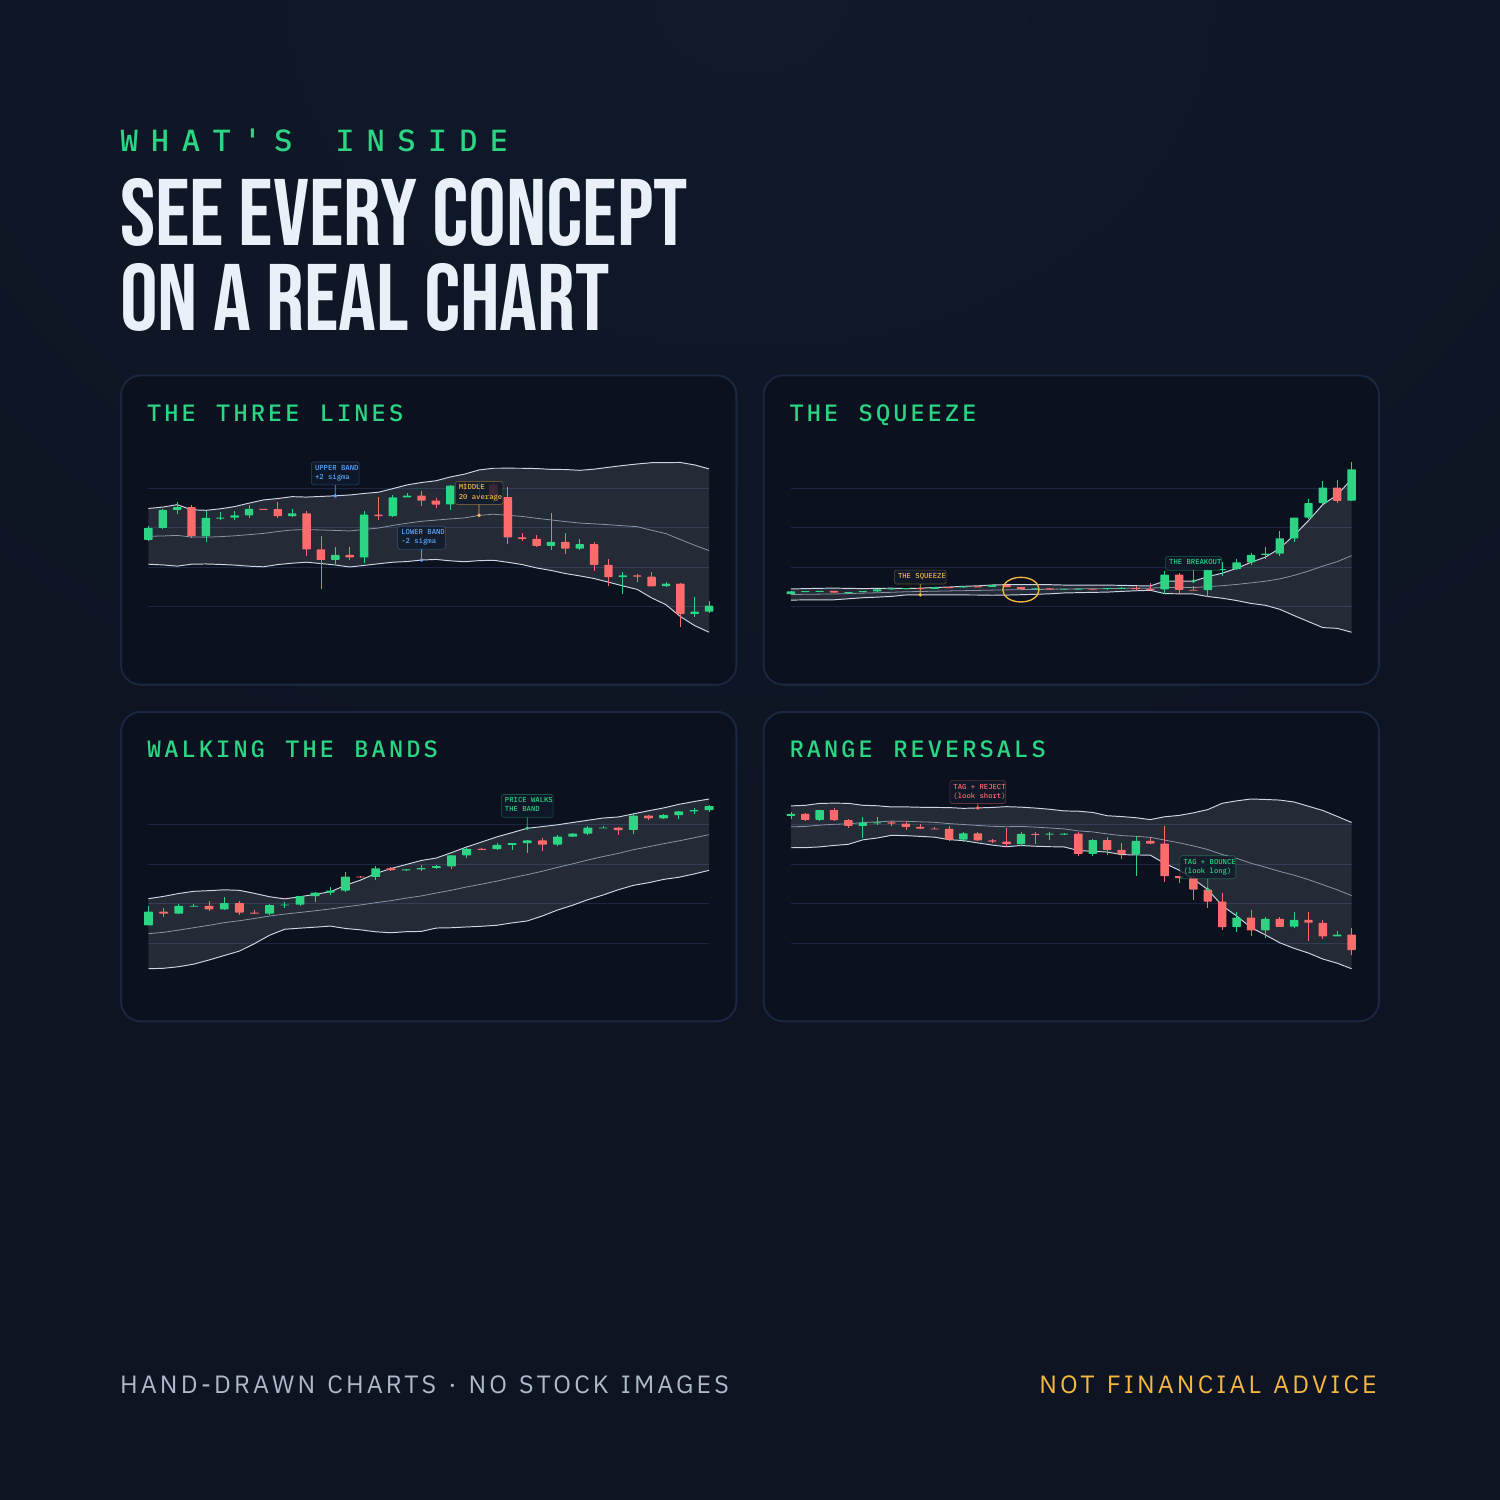
- Every concept shown on a real, hand-drawn chart
- Ends with a step-by-step strategy + printable checklist
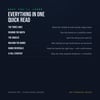
📂 What's Inside
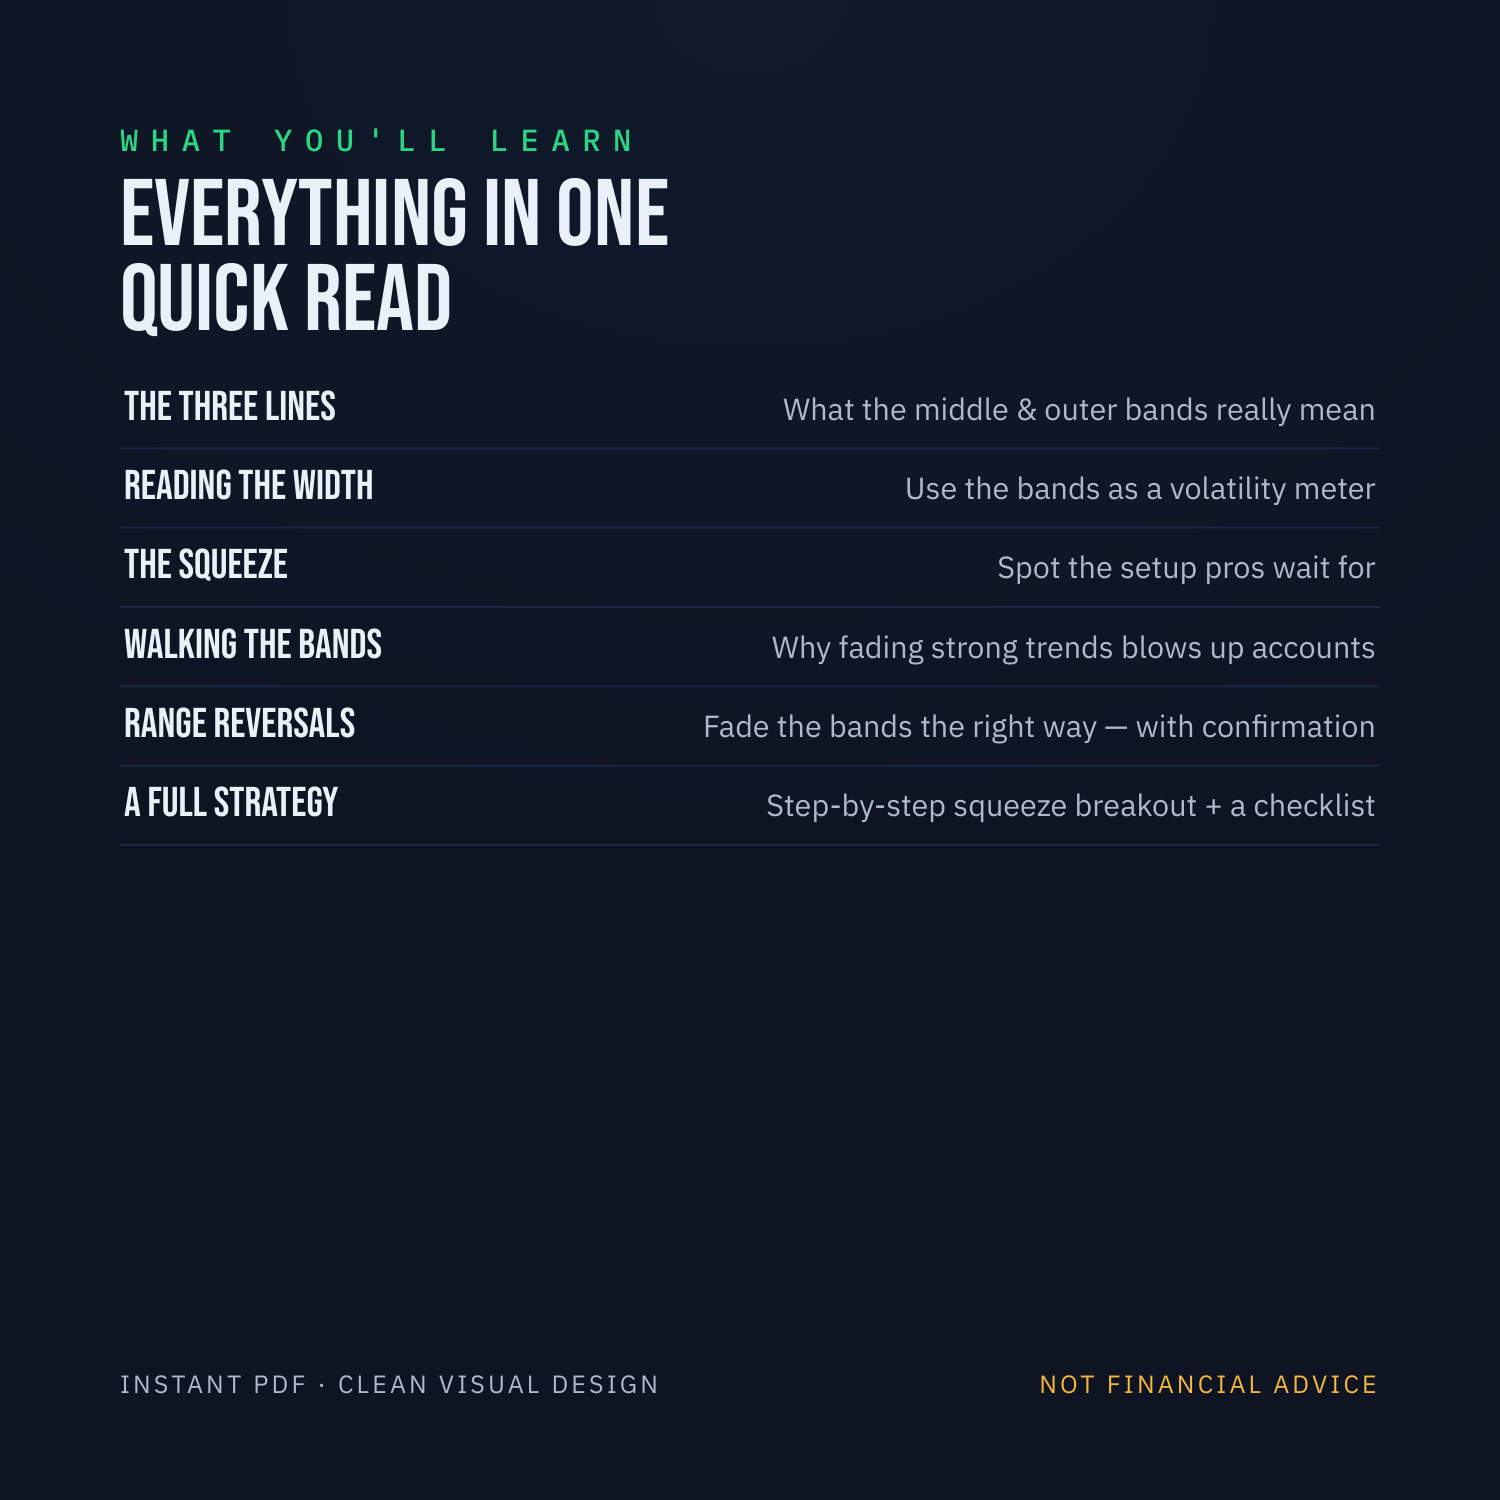
- The three lines — what the middle and outer bands really mean
- Reading the width — use the bands as a live volatility meter
- The squeeze — spot the low-volatility setup pros wait for
- Walking the bands — why fading strong trends blows up accounts
- Range reversals — how to fade the bands the right way, with confirmation
- The #1 mistake — the band-touch trap every beginner falls for
- Full strategy — step-by-step squeeze-breakout method + pre-trade checklist
✅ What You'll Be Able To Do
- Tell when a big move is loading — before it happens
- Know when to trade with a trend vs fade a range
- Stop treating a band touch as an automatic buy/sell
- Follow a simple, testable strategy with defined risk
⚠️ The Honest Note
Bollinger Bands are a tool for reading volatility and context — they're clues, not a crystal ball. No indicator predicts the future.
Educational only, not financial advice.
📦 What You Get
- Instant PDF download — 11 pages, clean visual design
- Works on any device — yours forever
- Pairs with: RSI, MACD, EMA, Stochastic guides + the Pro Trading Journal