
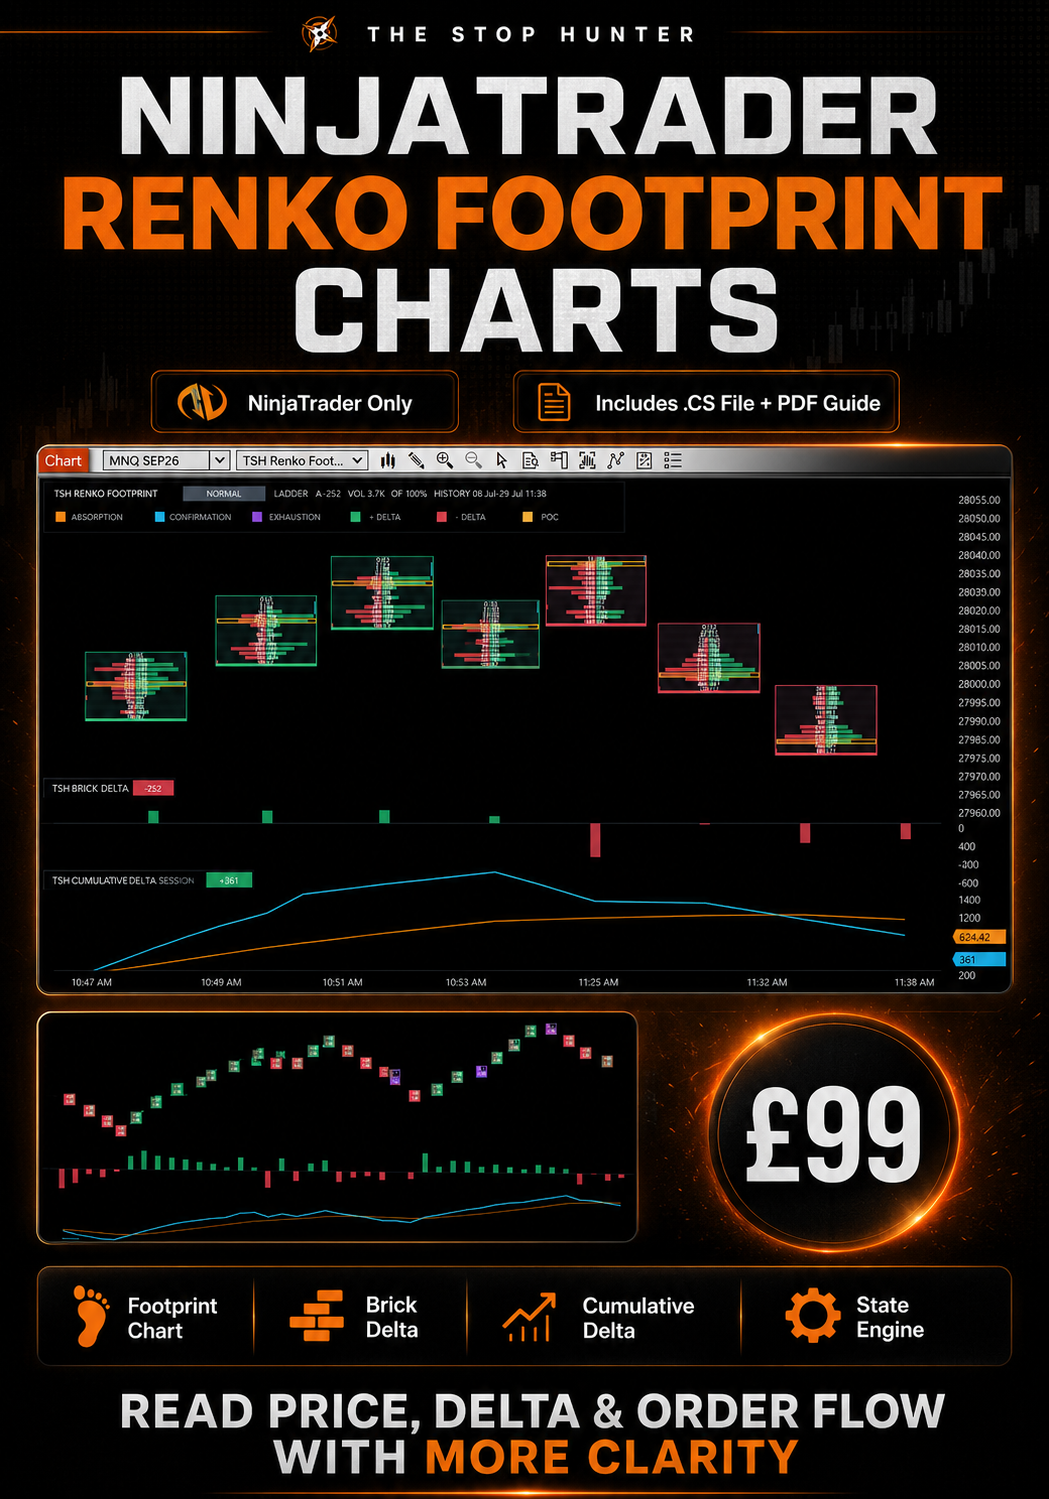
TSH Renko Footprint Charts for NinjaTrader
NinjaTrader Renko Footprint Charts
Read Renko price action, delta and order flow with more clarity
The TSH NinjaTrader Renko Footprint Charts combine Renko price structure with footprint-style order-flow analysis inside NinjaTrader Desktop.
Instead of viewing Renko bricks as price movement alone, the suite adds bid and ask activity, brick delta, cumulative delta, point of control and visual order-flow states.
Built for futures traders who want a clearer way to study:
- buying and selling pressure;
- participation inside each Renko brick;
- changes in momentum;
- possible absorption;
- directional confirmation;
- potential exhaustion;
- the relationship between price structure and order flow.
Price
£99
Platform
NinjaTrader Desktop only
(This version is not currently available for TradingView, MetaTrader, Sierra Chart or other platforms.)
What is included
TSH Renko Footprint Chart
A custom Renko footprint chart that displays order-flow information directly within the Renko structure.
Depending on the chart zoom level, the chart can display:
- bid and ask volume;
- footprint price levels;
- per-level volume histograms;
- point of control;
- brick volume;
- brick delta;
- directional Renko colouring;
- absorption, confirmation and exhaustion states;
- adaptive detail as the chart is zoomed in or out.
At wider zoom levels, the chart automatically reduces unnecessary detail so the main Renko structure remains readable.
At closer zoom levels, more footprint information becomes visible.
TSH Renko Brick Delta
A separate lower-panel indicator showing the delta of each completed Renko brick.
Positive bars indicate more ask-side than bid-side activity.
Negative bars indicate more bid-side than ask-side activity.
Brick Delta can help identify:
- strength behind a Renko move;
- weakening participation;
- opposing order flow;
- divergence between price direction and delta;
- unusually strong buying or selling pressure.
TSH Renko Cumulative Delta
A separate lower-panel indicator that accumulates brick delta over time.
The indicator includes:
- Session mode;
- Continuous mode;
- Rolling mode;
- raw or smoothed display;
- optional moving averages;
- independent panel scaling.
Cumulative Delta can help traders compare the broader order-flow direction with the Renko price trend.
TSH State Engine
The chart includes a visual State Engine designed to highlight selected order-flow conditions.
Absorption
Absorption appears when aggressive buying or selling activity is present, but price fails to move in the expected direction.
This can suggest that passive market participants are absorbing aggressive orders.
Absorption bricks are displayed in orange.
Confirmation
Confirmation appears when Renko direction, delta and participation are aligned.
This is a TSH composite state designed to highlight stronger directional agreement between price and order flow.
Confirmation bricks are displayed in cyan.
Exhaustion
Exhaustion appears when an established directional move begins to show reduced participation or weakening order-flow pressure.
This may indicate that the current move is losing energy, although it does not automatically mean that a reversal will occur.
Exhaustion bricks are displayed in purple.
The State Engine is fully adjustable. Users can make the states more selective or more sensitive depending on the instrument, Renko block size, trading session and data feed.
Point of control and footprint histograms
When the chart is zoomed in sufficiently, the Footprint Chart can display:
- bid and ask values at each visible price area;
- horizontal volume histograms;
- the highest-volume price area inside the brick;
- a highlighted point of control;
- imbalance information;
- brick delta and total volume.
The chart groups price levels adaptively when necessary so that footprint detail remains readable rather than trying to force every exchange tick into an unusably small row.
Why combine Renko and footprint analysis?
Traditional Renko charts help remove some time-based noise and present price movement in a structured brick format.
Traditional footprint charts show how volume and aggressive buying and selling are distributed through price.
The TSH Renko Footprint Charts bring those two approaches together.
This can help traders assess not only what price did, but also how order flow behaved while the Renko brick formed.
The charts may be used to study:
- trend continuation;
- pullbacks;
- reversals;
- breakout participation;
- failed moves;
- delta divergence;
- high-volume price areas;
- weakening momentum;
- shifts in buying and selling pressure.
A practical three-chart workflow
1. Start with the Footprint Chart
Use the Footprint Chart to assess:
- the Renko trend;
- the current brick direction;
- the footprint ladder;
- point of control;
- volume concentration;
- absorption, confirmation and exhaustion states.
2. Check Brick Delta
Use Brick Delta to assess whether the current brick has:
- strong aligned delta;
- weak participation;
- opposing delta;
- an unusually large positive or negative reading.
3. Check Cumulative Delta
Use Cumulative Delta to assess the broader order-flow direction.
For example:
- rising Renko price and rising Cumulative Delta may support the bullish move;
- falling Renko price and falling Cumulative Delta may support the bearish move;
- rising price with weakening Cumulative Delta may indicate reduced confirmation;
- falling price with improving Cumulative Delta may indicate a possible divergence.
No single reading should be treated as a standalone trade signal.
What you receive
Your download includes:
- the complete NinjaTrader .cs source file;
- TSH Renko Footprint BarsType;
- TSH Renko Footprint Chart;
- TSH Renko Pressure Chart;
- TSH Renko Brick Delta;
- TSH Renko Cumulative Delta;
- adjustable State Engine;
- PDF installation and user guide;
- installation instructions;
- input and setting explanations;
- practical workflow guidance;
- State Engine calibration guidance;
- troubleshooting information.
Who is this for?
The TSH Renko Footprint Charts are designed for traders who:
- use NinjaTrader Desktop;
- trade or analyse futures markets;
- already use Renko charts;
- want to add order-flow context to Renko price structure;
- want a visual alternative to ordinary time-based footprint charts;
- study delta, cumulative delta and volume;
- prefer analytical tools rather than signal services;
- want adjustable software they can test and configure.
A basic understanding of Renko charts, futures markets and technical analysis is recommended.
Installation
The product is supplied as a NinjaTrader .cs source file.
The included PDF guide explains:
- where to install the file;
- how to compile it inside NinjaTrader;
- how to create a TSH Renko Footprint chart;
- how to add the three chart components;
- how to arrange the lower panels;
- what each input means;
- how to configure the State Engine;
- how to troubleshoot common installation or data issues.
Only one version of the source file should be installed at a time. Leaving older versions in the NinjaTrader Custom folder can cause duplicate-definition compilation errors.
Data requirements and limitations
The quality of footprint, delta and cumulative-delta analysis depends heavily on the underlying market data.
The charts are only as good as the data supplied by:
- your broker;
- your NinjaTrader connection;
- your historical data provider;
- your real-time data feed.
Some providers may supply complete tick and volume history for one futures market but limited or inconsistent historical data for another.
This can affect:
- footprint price levels;
- bid and ask volume;
- Brick Delta;
- Cumulative Delta;
- State Engine calculations;
- historical chart coverage.
The software cannot recreate order-flow data that the provider did not supply.
Real-time results may also differ from historical results if the historical feed contains less detail than the live feed.
Users are responsible for checking their data connection and confirming that sufficient tick, bid, ask and volume data are available for the instrument being analysed.
Important information
The TSH NinjaTrader Renko Footprint Charts are analytical and educational tools.
They are not:
- a trading system;
- a signal service;
- financial advice;
- investment advice;
- a promise of profitable trading;
- a replacement for risk management.
The presence of absorption, confirmation, exhaustion, high delta, divergence or any other chart condition does not guarantee that price will move in a particular direction.
Order-flow conditions can fail.
Market behaviour can change.
Settings that appear effective on one instrument, block size or session may perform poorly on another.
Users should test all settings thoroughly before using the software in a live trading environment.
Risk warning
Trading futures, CFDs, spread bets, options, cryptocurrencies and other leveraged financial products involves substantial risk.
Losses can exceed expectations and may occur quickly.
These products are not suitable for everyone.
Past performance, historical charts, simulated results and backtests do not guarantee future results.
Backtests may be affected by:
- data quality;
- historical bid and ask availability;
- spread assumptions;
- commissions;
- slippage;
- latency;
- contract rollover;
- session templates;
- chart construction;
- hindsight bias;
- overfitting.
Always understand the product being traded, use appropriate position sizing and never risk money you cannot afford to lose.
Software disclaimer
The software is supplied as a trading-analysis tool.
Although it has been tested, no software can be guaranteed to be free from:
- bugs;
- compatibility issues;
- platform changes;
- data-feed issues;
- calculation differences;
- interruptions;
- display errors.
NinjaTrader updates, broker changes or data-provider changes may affect the software.
Users should verify calculations and chart behaviour independently.
The Stop Hunter and Stephen Hoad accept no responsibility for trading losses, missed trades, technical failures, data problems or decisions made using the software.
No refunds based on trading performance
The product provides downloadable digital software and educational documentation.
Results will vary between users, markets, settings, block sizes, data feeds and trading methods.
A lack of profitable trading results does not mean the software is defective.
Please confirm that you use NinjaTrader Desktop and understand the product requirements before purchasing.