


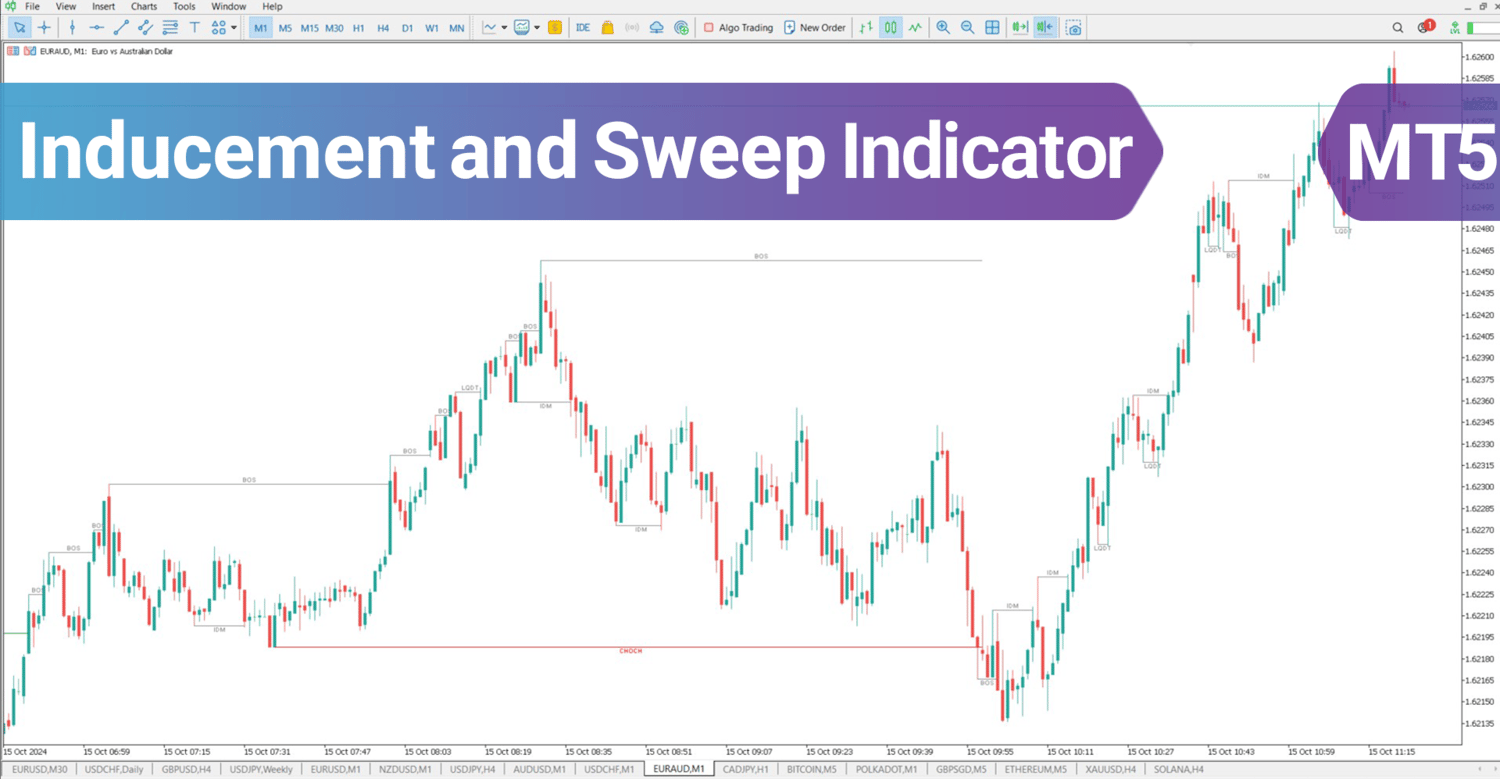


Inducement and Sweep ICT Indicator for MT5 Download – Free – [TradingFinder]
The MSIS Indicator in MT5🧭 is a next-generation analytical tool designed for Smart Money and ICT-style traders who seek to uncover the hidden mechanics of price movements.
By detecting liquidity hunts, false breakouts, and inducement zones, this indicator reveals where institutional traders accumulate orders and how retail traders are often trapped before major reversals. 💰
📊 MSIS Indicator Specifications
📂 Categories:
ICT MT5 Indicators
Smart Money MT5 Indicators
Liquidity MT5 Indicators
🖥️ Platform: MetaTrader 5
🎯 Skill Level: Advanced
⚙️ Type: Reversal Indicator
⏱️ Timeframe: Multi-Timeframe
💼 Trading Style: Scalping | Day Trading
🌍 Markets: Forex | Crypto | Stocks | Indices | Commodities
💡 MSIS Indicator Overview
The Market Structure & Liquidity Hunt (MSIS) indicator automatically identifies and marks key market structure points, including:
- Change of Character (CHoCH) 🔄 – Detects trend reversals.
- Break of Structure (BOS) 📈 – Confirms trend continuation.
- Inducement (IDM) 🎯 – Highlights fake moves that attract liquidity.
- Liquidity Zones 💦 – Marks regions of institutional order collection.
With these elements combined, MSIS provides traders with a clear visualization of Smart Money activity, making it easier to understand where liquidity is gathered and false signals are triggered before genuine market moves begin.
📈 Uptrend Example
On the GBP/USD 4-hour chart, the indicator detects a Change of Character (CHoCH) signaling a shift to bullish momentum.
Each Break of Structure (BOS) is then highlighted as price forms new higher highs. After liquidity sweeps, the MSIS marks Inducement Zones (IDM) — showing where institutional buying pressure re-enters the market.
🟢 Insight: Liquidity hunts in bullish phases often represent accumulation points for Smart Money entries.
📉 Downtrend Example
In the USD/JPY 1-hour chart, after a CHoCH, the market transitions into a downtrend.
The MSIS indicator detects liquidity sweeps above resistance zones, where many traders mistakenly go long.
Once liquidity is trapped, price resumes downward movement, marking Break of Structure (BOS) levels and Inducement Zones along the way.
🔴 Insight: Bearish liquidity hunts frequently indicate distribution phases, where large players offload positions before continuation.
⚙️ MSIS Settings
🎨 Chart Theme: Customize colors for background and structure highlights.
🕯️ Candles to Check: Defines the number of bars analyzed for structure detection.
🔁 Swing CHoCH: Adjusts the sensitivity for detecting trend reversals.
📉 Swing BOS: Controls how the indicator identifies structure breaks.
⚡ Swing Inducement: Fine-tunes how inducement zones are calculated.
✨ Conclusion
The Market Structure & Liquidity Hunt (MSIS) indicator gives traders an institutional-level perspective of market dynamics.
By combining CHoCH, BOS, IDM, and Liquidity Zone detection, it transforms complex market data into clear, actionable signals — empowering traders to follow the Smart Money flow with confidence and precision. 🦅