


On-Chain Data Explained — Measured (PDF Guide)
On-chain data is sold as the thing that separates serious analysis from chart-reading. Addresses, transactions, flows -- real numbers from a public ledger. Nobody has told you how many of those numbers have been tested, or against what.
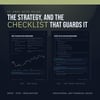
This guide measures two of the most quoted on-chain series against the same control as the rest of the wave, and then does the thing the capstone exists for: prints all 20 tests side by side, shows why the best of them is not a finding, and lists the two measurement errors this study made and caught. This is a 44-page PDF that teaches On-Chain Data from the first thing you see on the screen through to a written strategy with an entry, a stop and an explicit rule for when the trade is wrong.
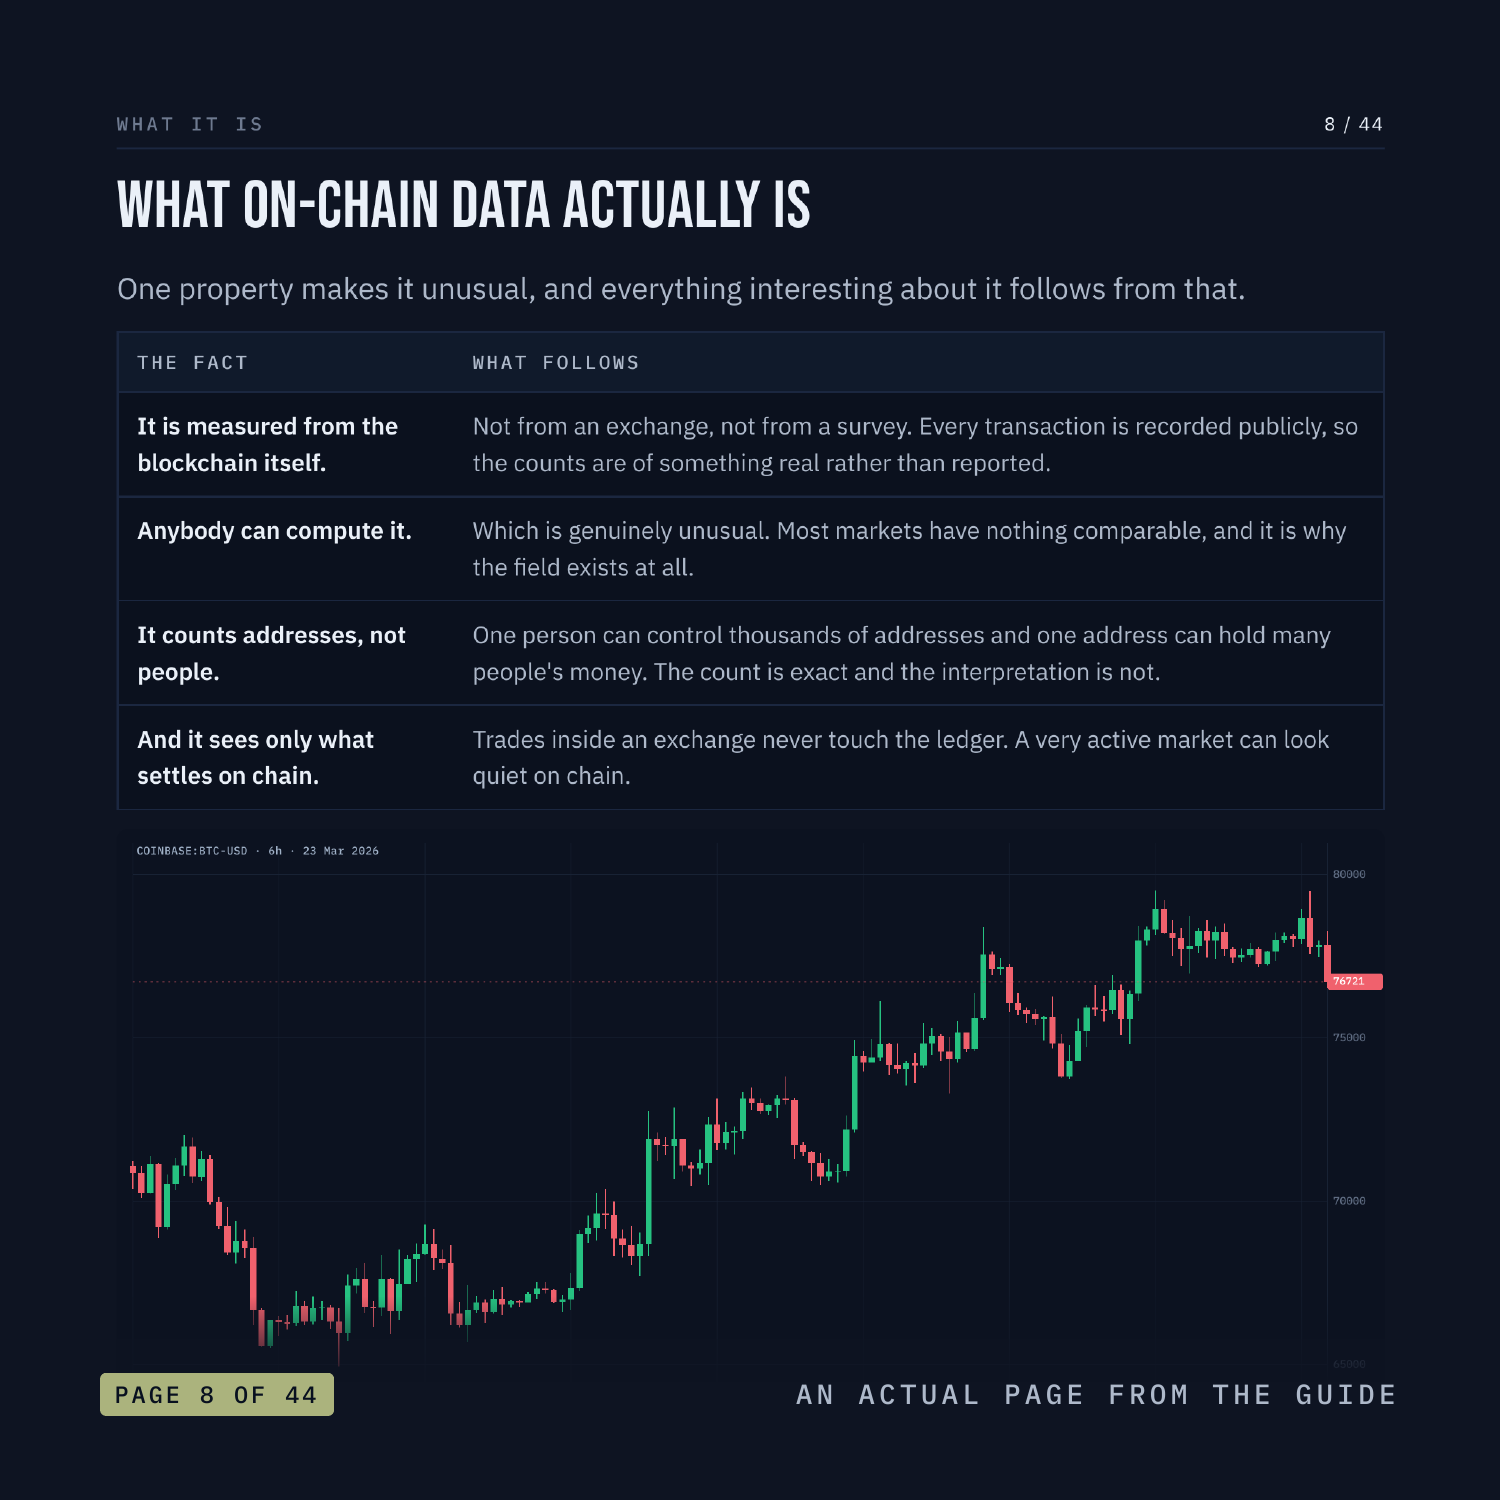
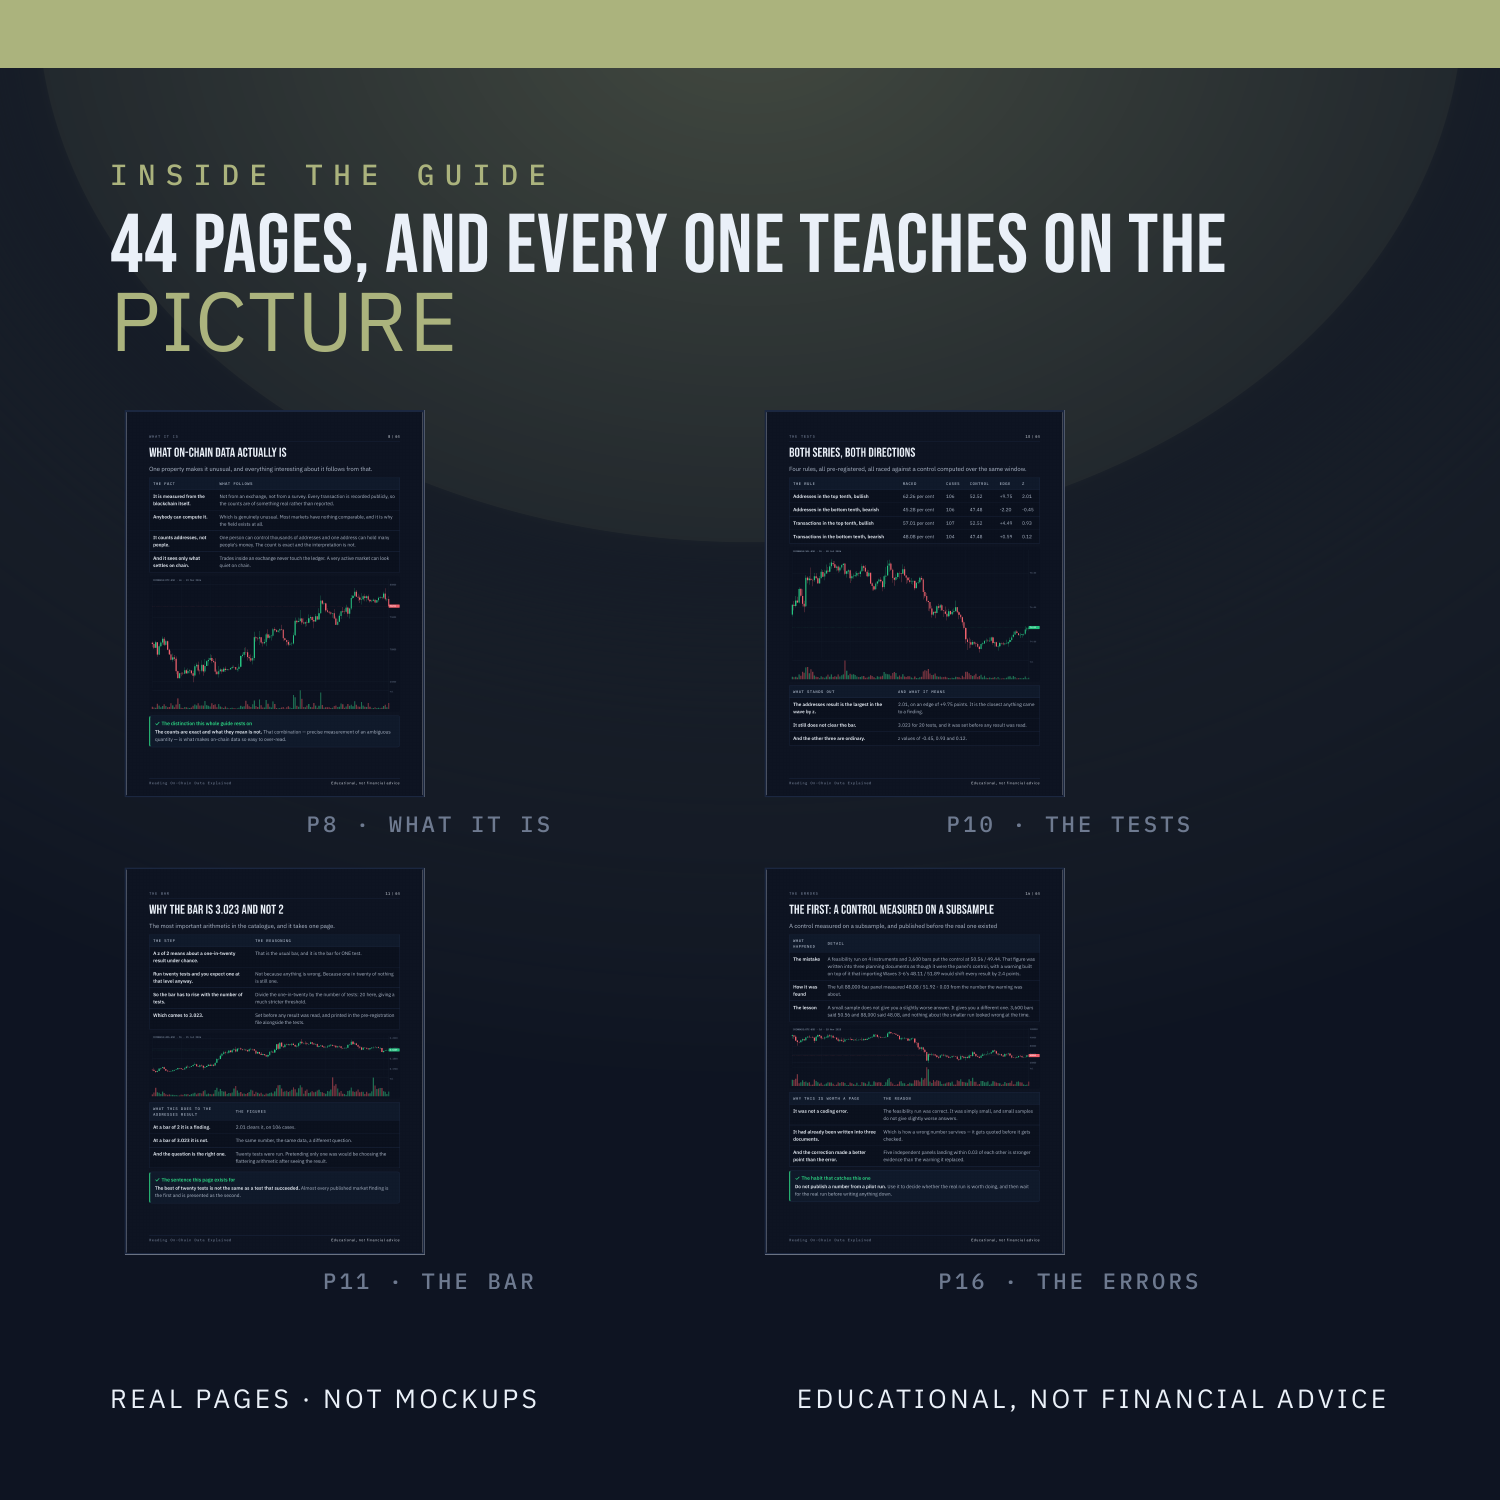
Nothing is taught underneath a chart. Every label sits on the candle, the line or the level it is describing, on real BTC, ETH, SOL and LINK charts. There are three quizzes on real charts, each followed by the same chart re-shown annotated with the reasoning, plus faded practice pages where the first steps are filled in and you finish the rest.
WHAT'S INSIDE
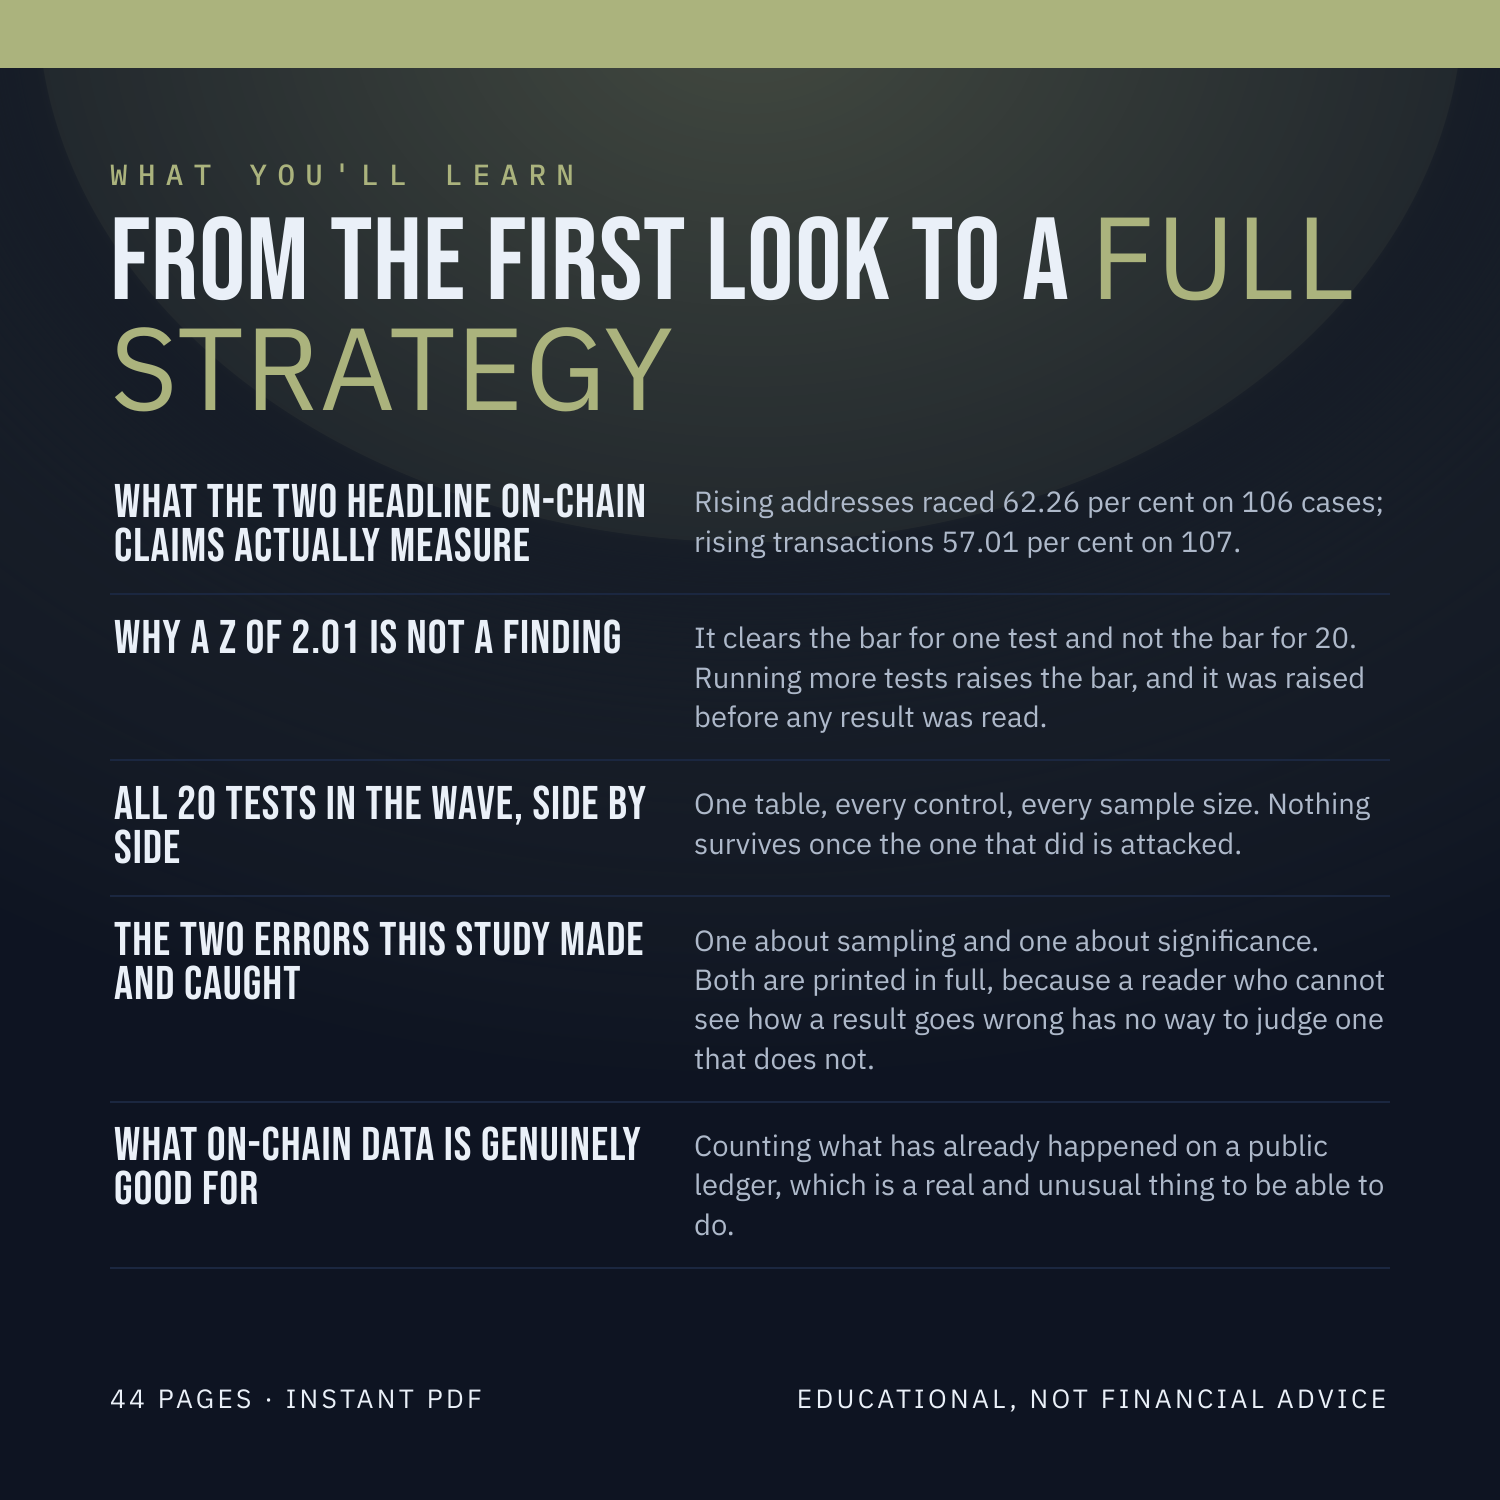
What the two headline on-chain claims actually measure -- Rising addresses raced 62.26 per cent on 106 cases; rising transactions 57.01 per cent on 107.
Why a z of 2.01 is not a finding -- It clears the bar for one test and not the bar for 20. Running more tests raises the bar, and it was raised before any result was read.
All 20 tests in the wave, side by side -- One table, every control, every sample size. Nothing survives once the one that did is attacked.
The two errors this study made and caught -- One about sampling and one about significance. Both are printed in full, because a reader who cannot see how a result goes wrong has no way to judge one that does not.
What on-chain data is genuinely good for -- Counting what has already happened on a public ledger, which is a real and unusual thing to be able to do.
WHAT YOU'LL BE ABLE TO DO
Say what an active address and a transaction count actually are.
Explain why the bar rises with the number of tests.
Read a z of 2 and ask how many tests it came from.
Name two ways a careful study still goes wrong.
Judge any on-chain claim by its control and its test count.
AN HONEST NOTE
On-Chain Data is a clue, not a crystal ball. It describes what price has already done. This guide contains no win-rates, no backtest results and no promises about what you will make, because nobody can verify those and you should not trust anyone who prints them. What it hands you instead is a set of rules you can test yourself on TradingView in an afternoon. Educational, not financial advice.
Instant download. 44 pages, PDF.