


Farmers Market Vendor
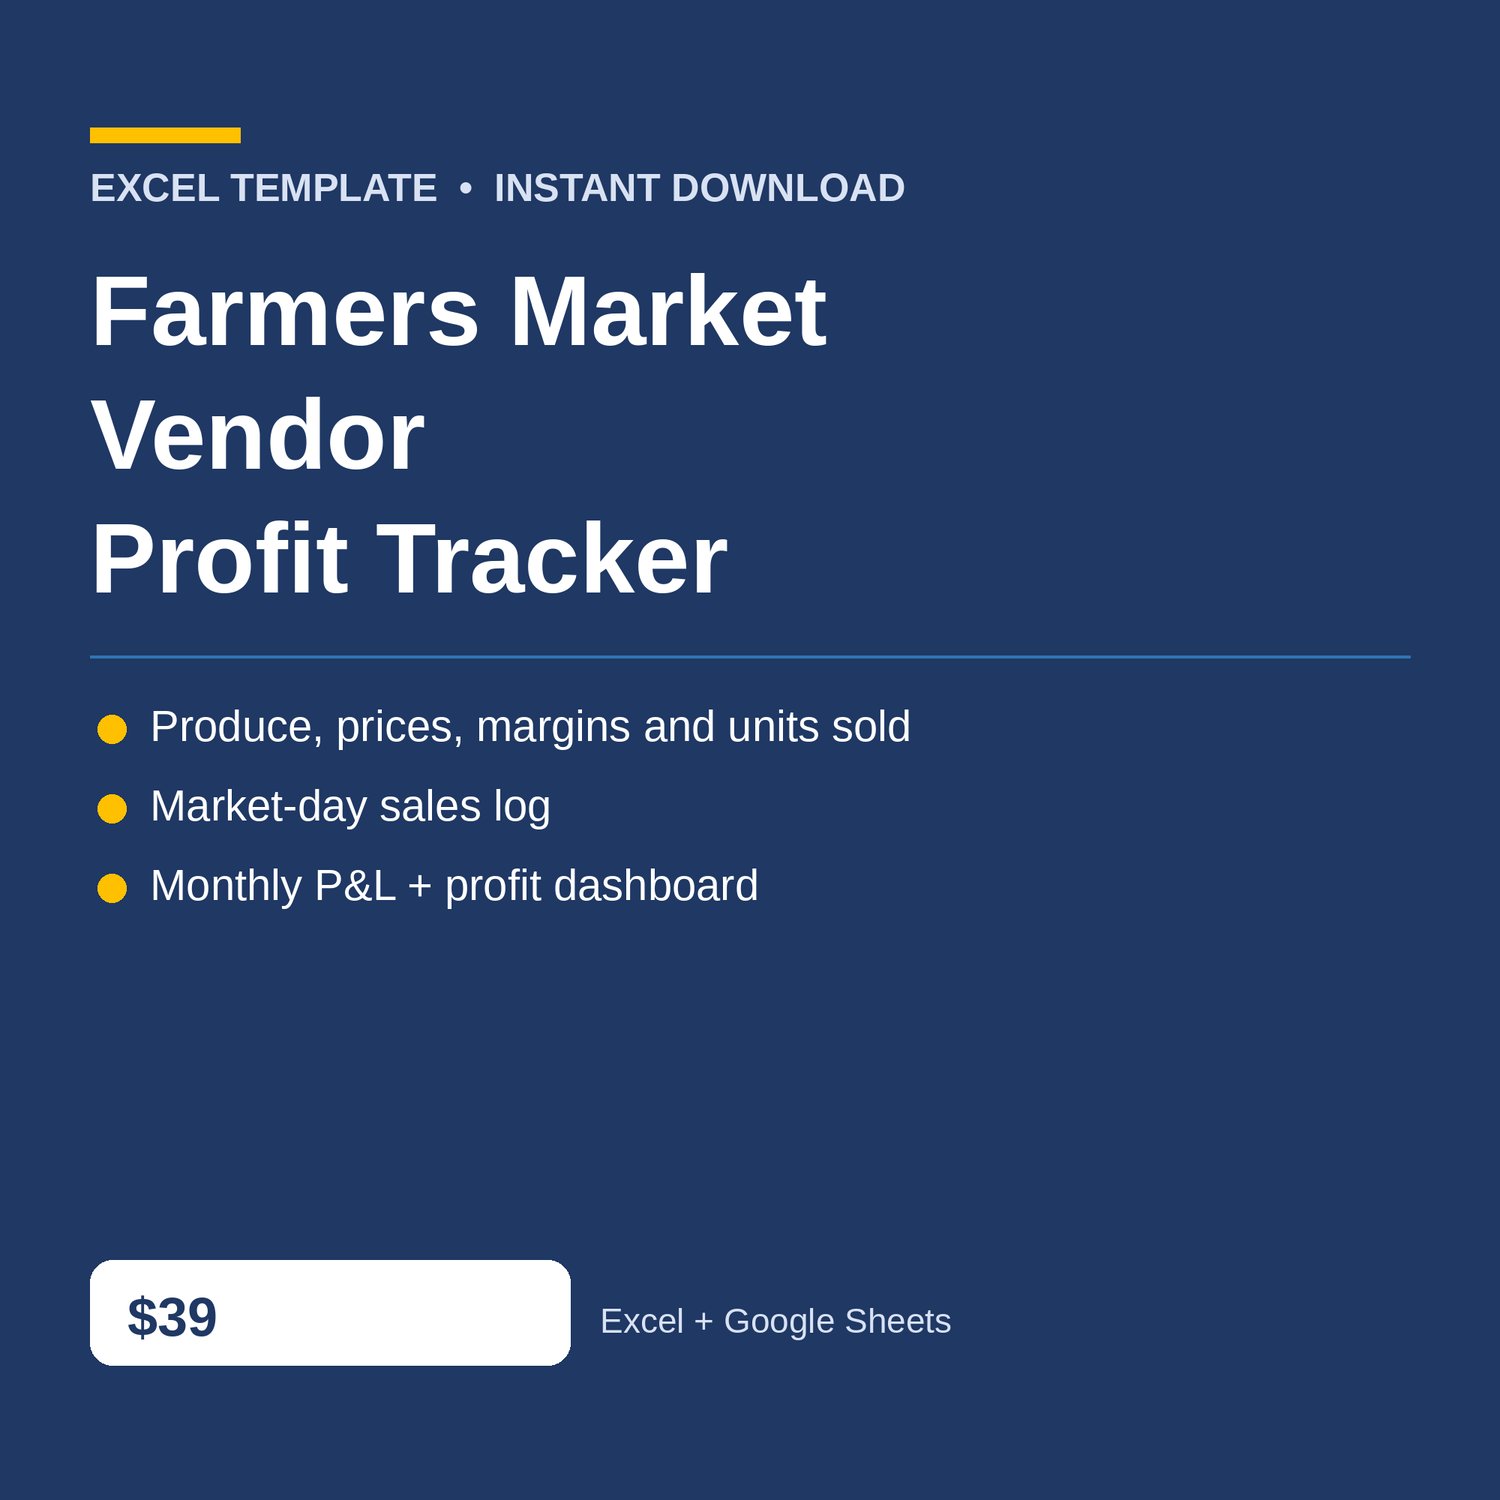
Farmers Market Vendor Profit Tracker Excel for your market stall - produce and goods, market-day sales, expenses, and a monthly P and L dashboard. Know which items actually make money at the market - and whether the month actually made money.
WHAT'S INCLUDED (6 sheets):
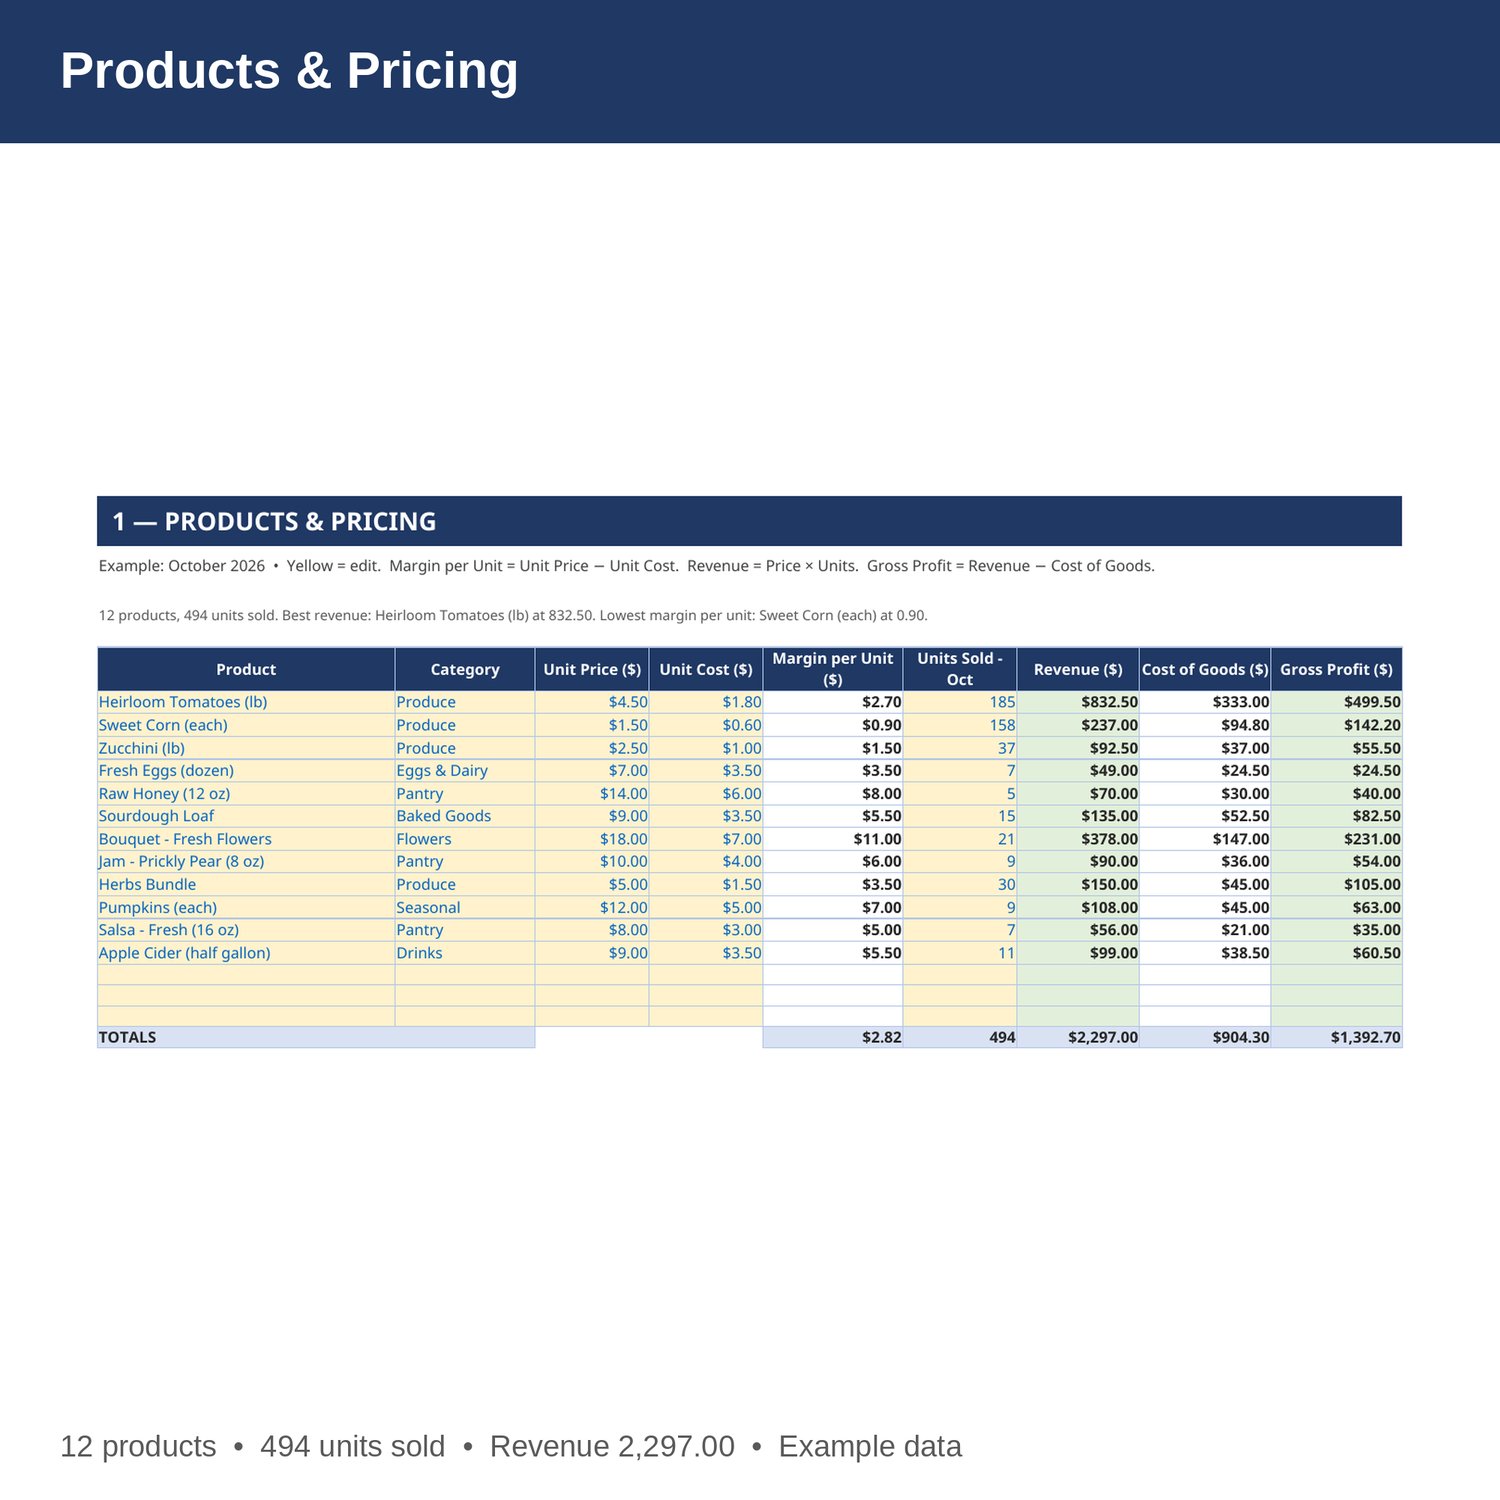
- Products and Pricing - item, category, unit price, unit cost, margin per unit, units sold, revenue, cost of goods, and gross profit for every item. Change a price and the margin and totals update.
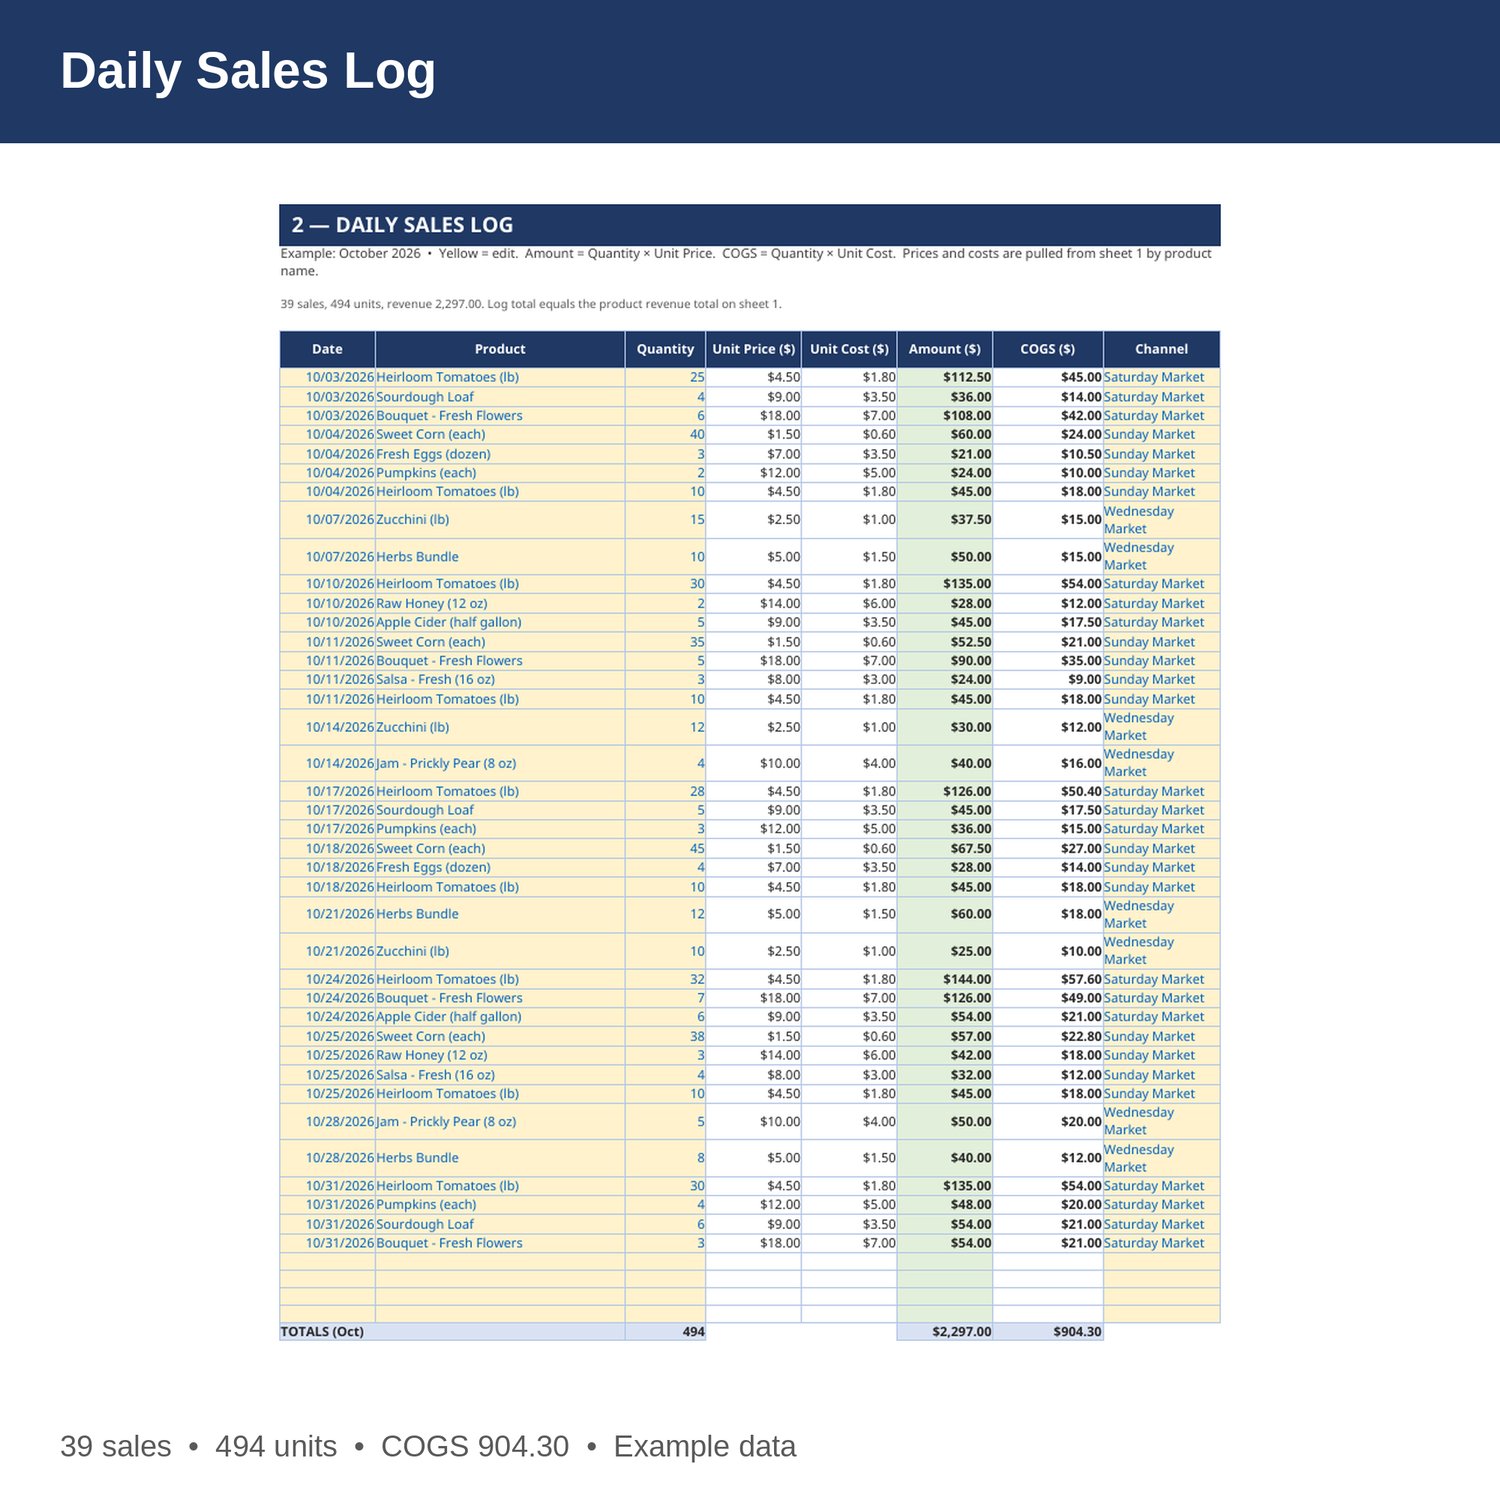
- Daily Sales Log - date, item, quantity, unit price, unit cost, amount, cost of goods, and market for every sale. Unit price and unit cost are pulled from sheet 1 by formula.
- Expenses - market fees, transport and fuel, materials and supplies, packaging, marketing, utilities, and other costs, with a monthly cost for each.
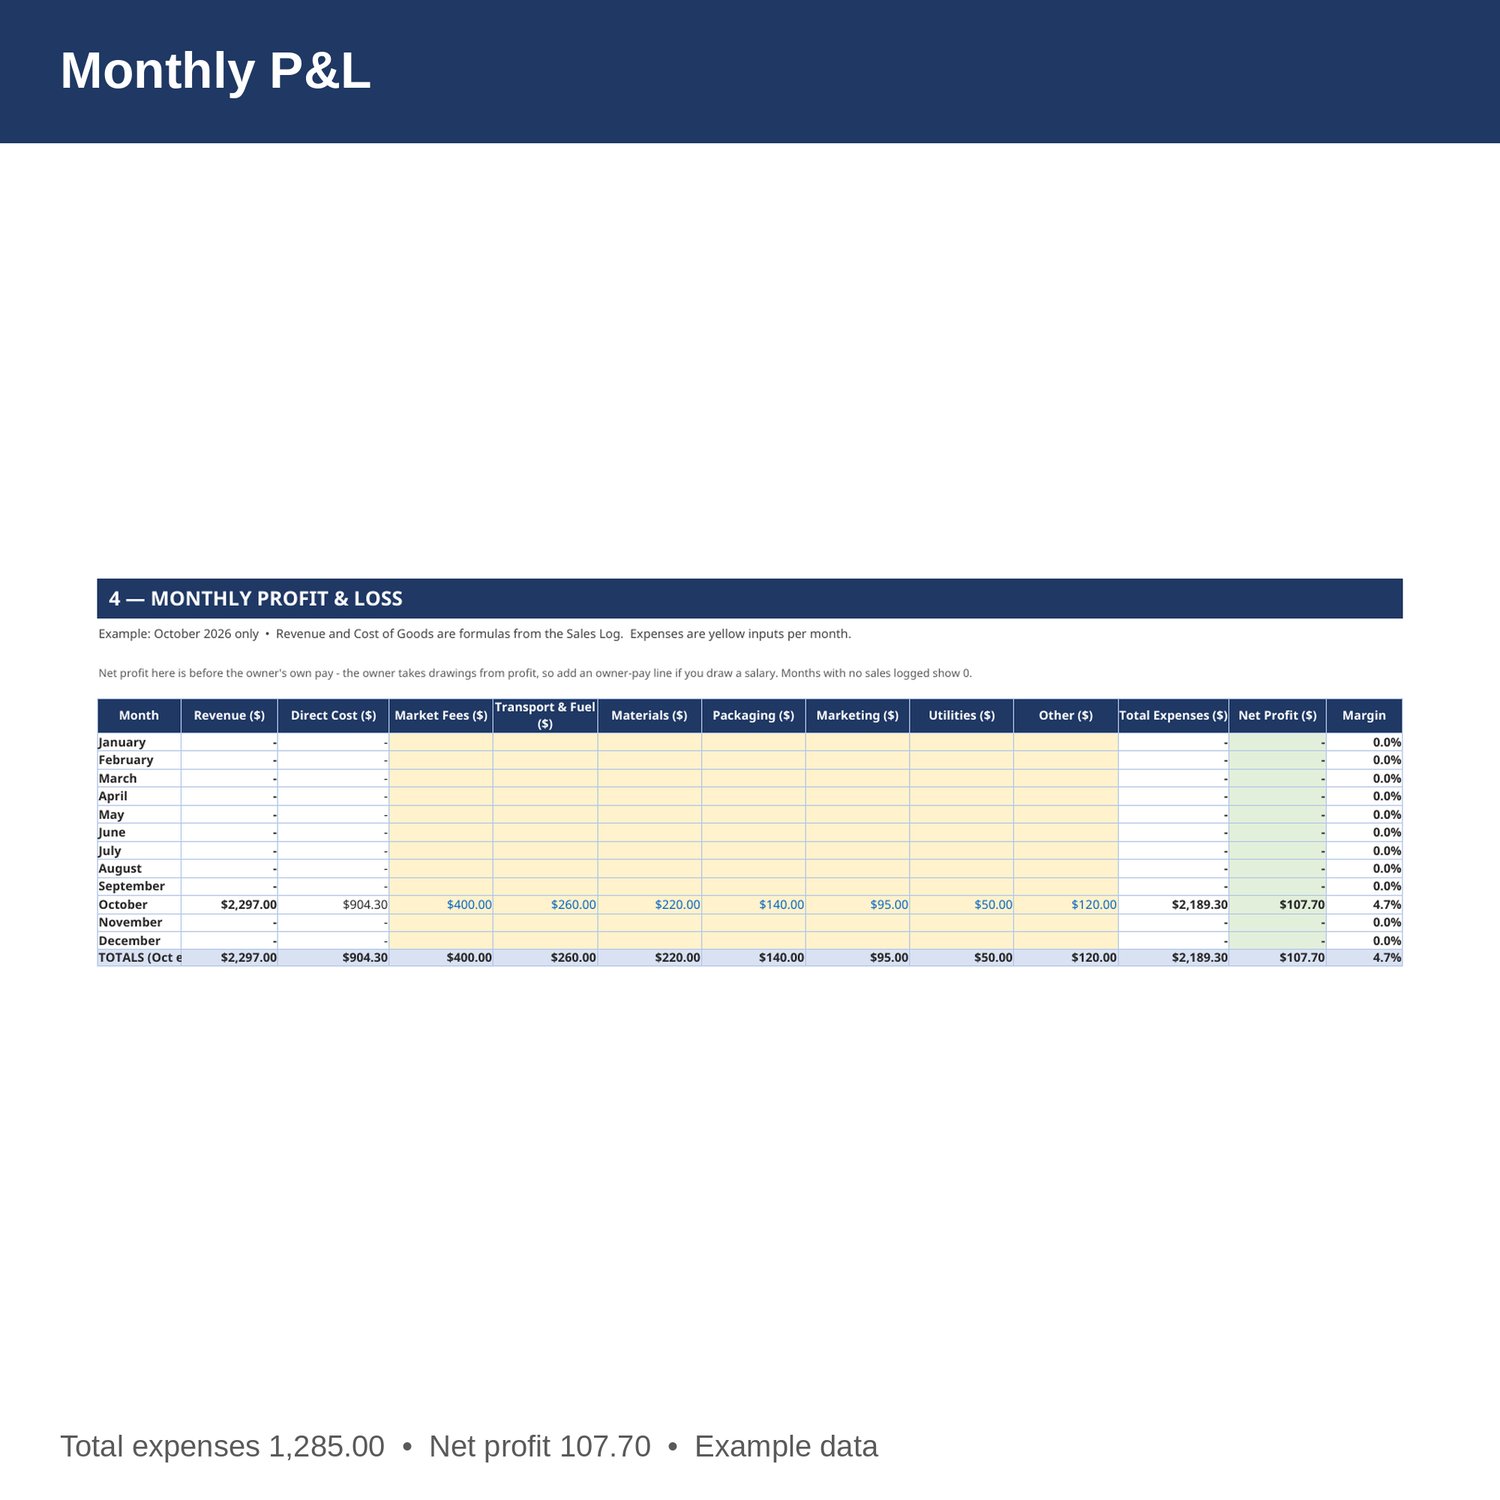
- Monthly P and L - revenue, cost of goods, market fees, transport and fuel, materials, packaging, marketing, utilities and other expenses by month, Jan-Dec, with net profit and margin. Revenue and cost of goods are formulas from the Sales Log.
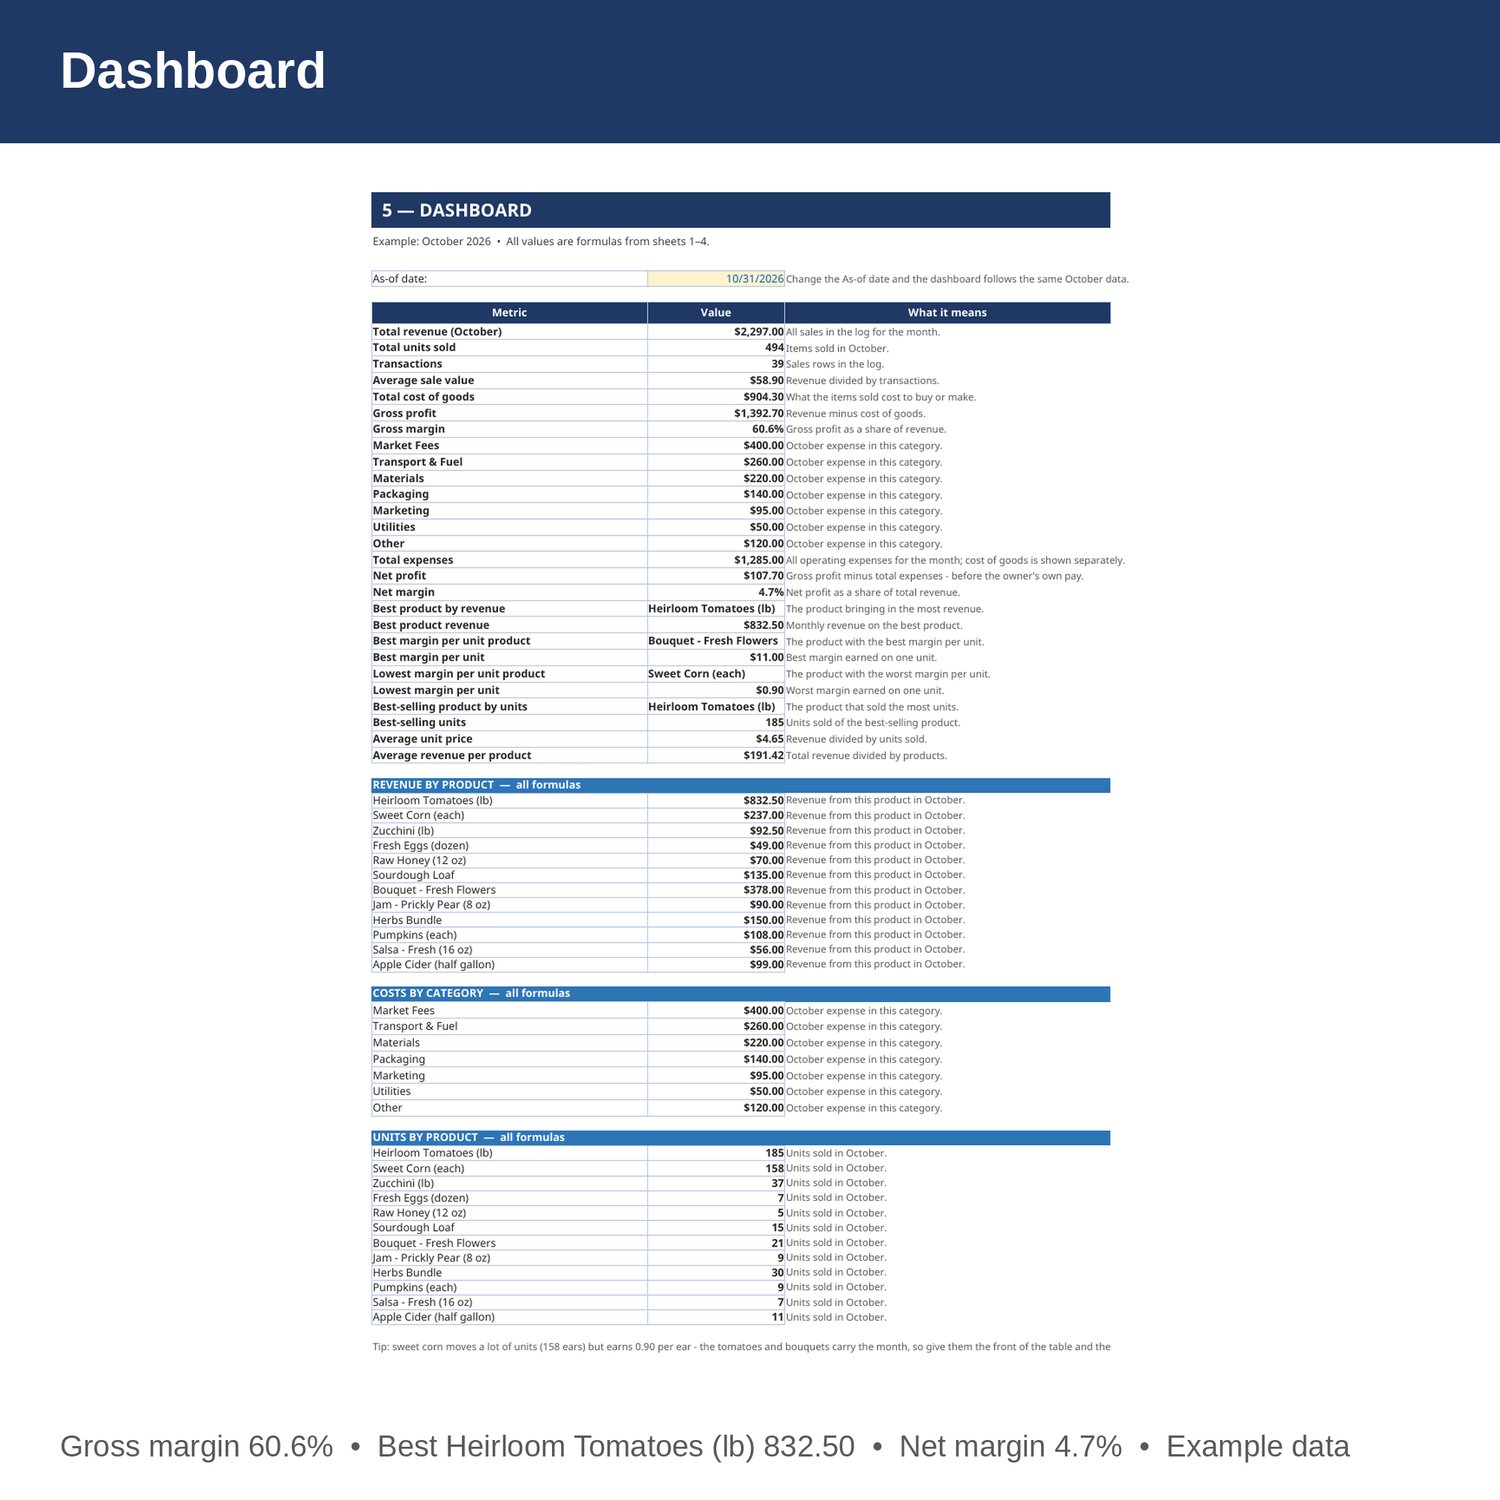
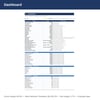
- Dashboard - total revenue, units sold, transactions, average sale value, gross profit and margin, expenses, net profit and margin, best and weakest products, revenue by product, costs by category, and units by product.
- Cover and How to Use - start here. Yellow cells are the only ones you edit.
EXAMPLE DATA (October 2026 - replace with your own numbers):
- 12 products; 494 units sold in 39 transactions; total revenue 2,297.00.
- Cost of goods 904.30; gross profit 1,392.70; gross margin 60.6 percent.
- Market Fees 400, Transport and Fuel 260, Materials 220, Packaging 140, Marketing 95, Utilities 50, Other 120; total expenses 1,285.00; net profit 107.70; net margin 4.7 percent.
- Best product by revenue: Heirloom Tomatoes (lb), 832.50. Best margin per unit: Bouquet - Fresh Flowers, 11.00 per unit. Lowest margin per unit: Sweet Corn (each), 0.90 per unit.
- Best seller by units: Heirloom Tomatoes (lb), 185 units. Average unit price 4.65; average revenue per product 191.42.
HOW IT WORKS:
1. Download the Excel file instantly after purchase.
2. On sheet 1, enter each product, category, unit price, and unit cost. Margin per unit, revenue, cost of goods, and gross profit fill in by formula.
3. On sheet 2, add a row per sale: date, product (spelled exactly as on sheet 1), quantity, and channel. Amount and cost of goods fill in by formula. Unit price and unit cost are pulled from sheet 1 by formula.
4. On sheet 3, enter each month's market fees, transport and fuel, materials, packaging, marketing, utilities and other costs.
5. On sheet 4, enter market fees, transport and fuel, materials, packaging, marketing, utilities and other expenses each month, then check gross margin and net profit on the Dashboard.
HOW THE NUMBERS WORK:
Margin per unit is unit price minus unit cost. Revenue is unit price times units sold. Cost of goods is unit cost times units sold. Gross profit is revenue minus cost of goods. Average sale value is total revenue divided by transactions. Net profit is gross profit minus market fees, transport and fuel, materials, packaging, marketing, utilities and other expenses.
WHO IT'S FOR:
Farmers market vendors, farm stand sellers, and small growers who want market-day sales, margins per item, and a monthly P and L in one workbook - without accounting software.
PLEASE NOTE:
- This is a digital download. No physical item will be shipped.
- Works in Microsoft Excel and Google Sheets (upload to Google Drive to open in Sheets).
- Example data for October 2026 is included (12 products, 494 units sold, 12 expense items). Replace it with your own numbers.
- The example October shows sweet corn sold 158 ears but only 0.90 profit per ear - tomatoes and flower bouquets carry the profit, not the corn. Stall fees of 400 are the biggest cost, and the Wednesday markets are the weakest days.
- This is a bookkeeping and planning tool only, not tax, legal, or CPA advice.
- Due to the nature of digital downloads, refunds are not available. Message me before buying if you have a question.
Built by an accountant: B.S. Accountancy, ASU W. P. Carey, with revenue-reconciliation experience at Marriott and audit work at PwC.