


Financial Ratio Calculator | 25+ Ratios Auto-Calculate | CPA Exam Study (XLSX Download)
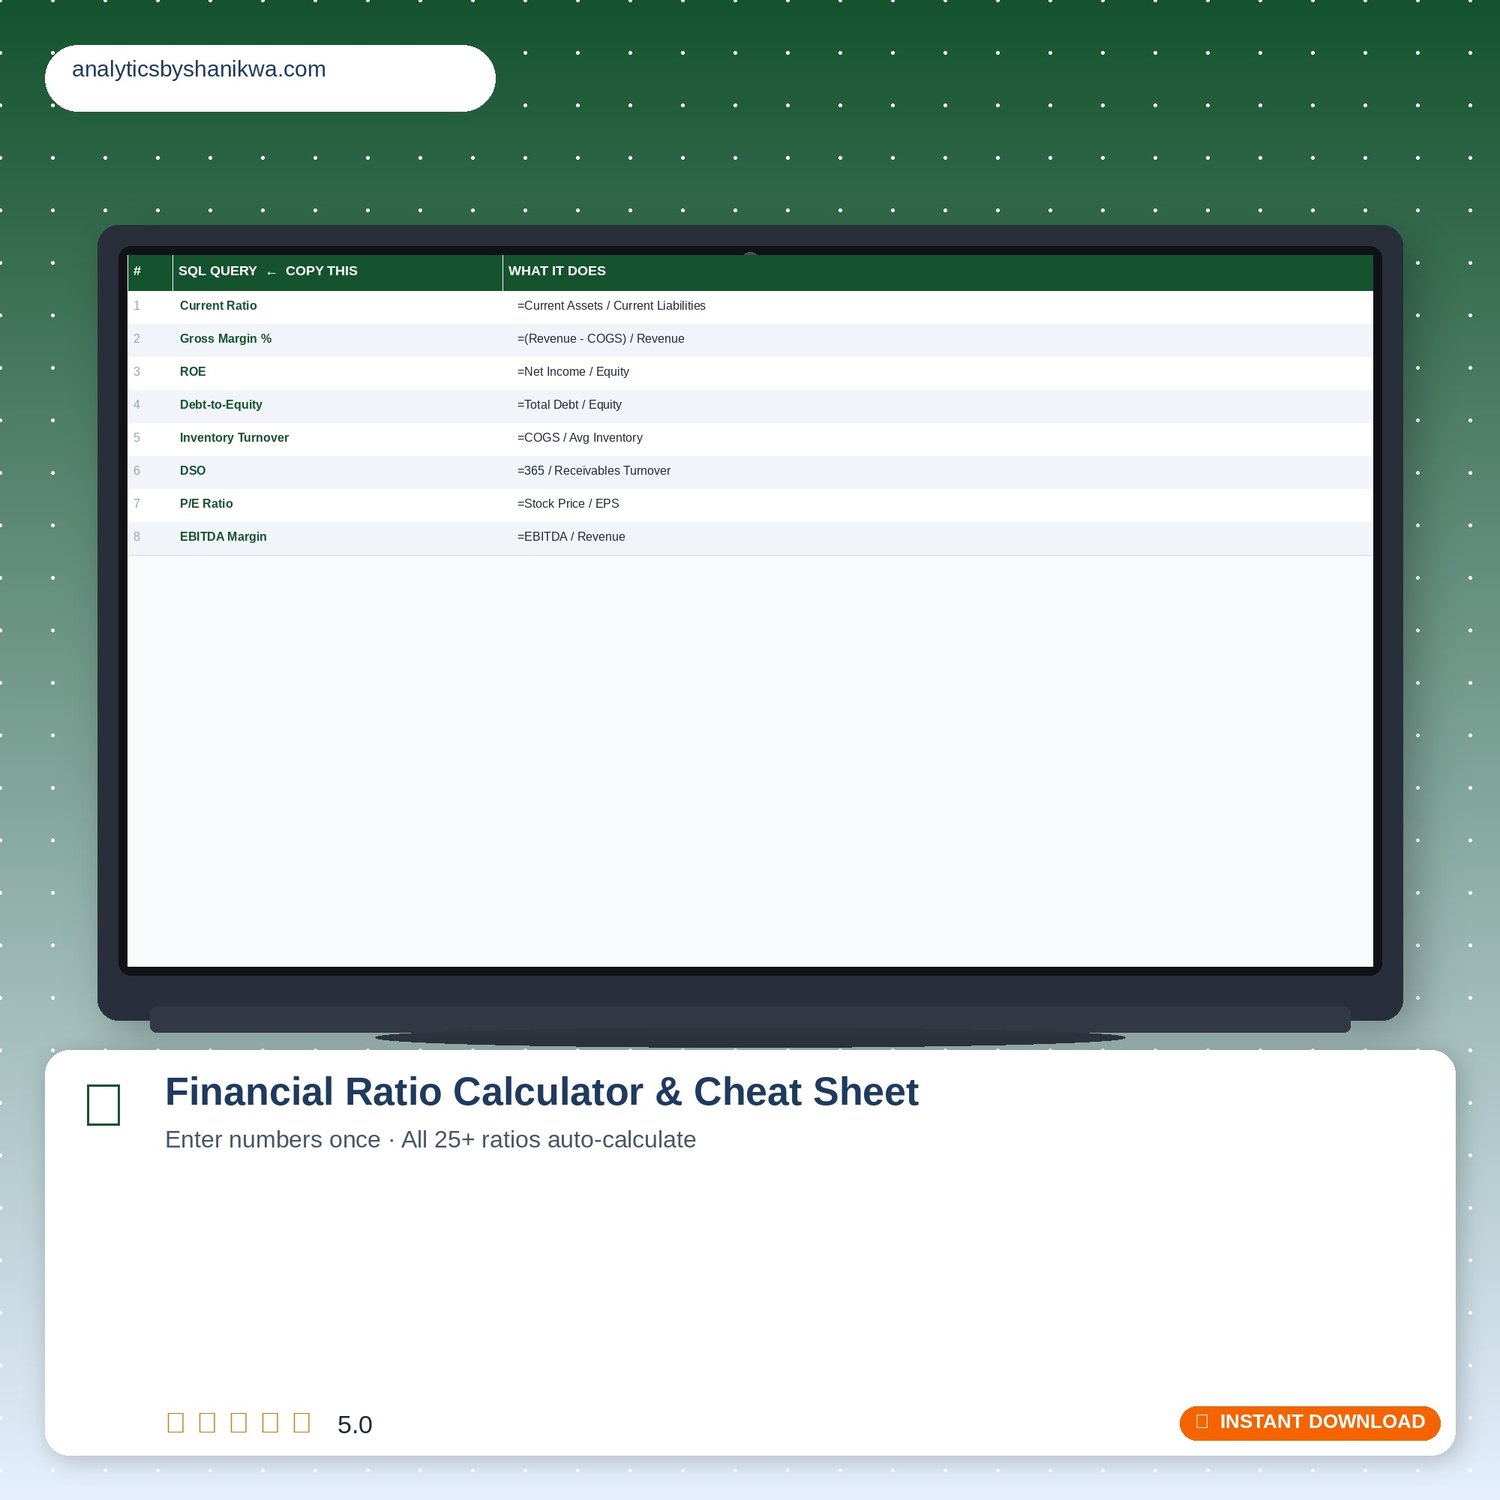
FINANCIAL RATIO CALCULATOR & CHEAT SHEET
Enter your numbers once — 25+ ratios calculate automatically
Type your income statement and balance sheet numbers into one input sheet. Switch to the next tab. Every ratio across 6 categories appears instantly.
─────────────────────────────────────────────
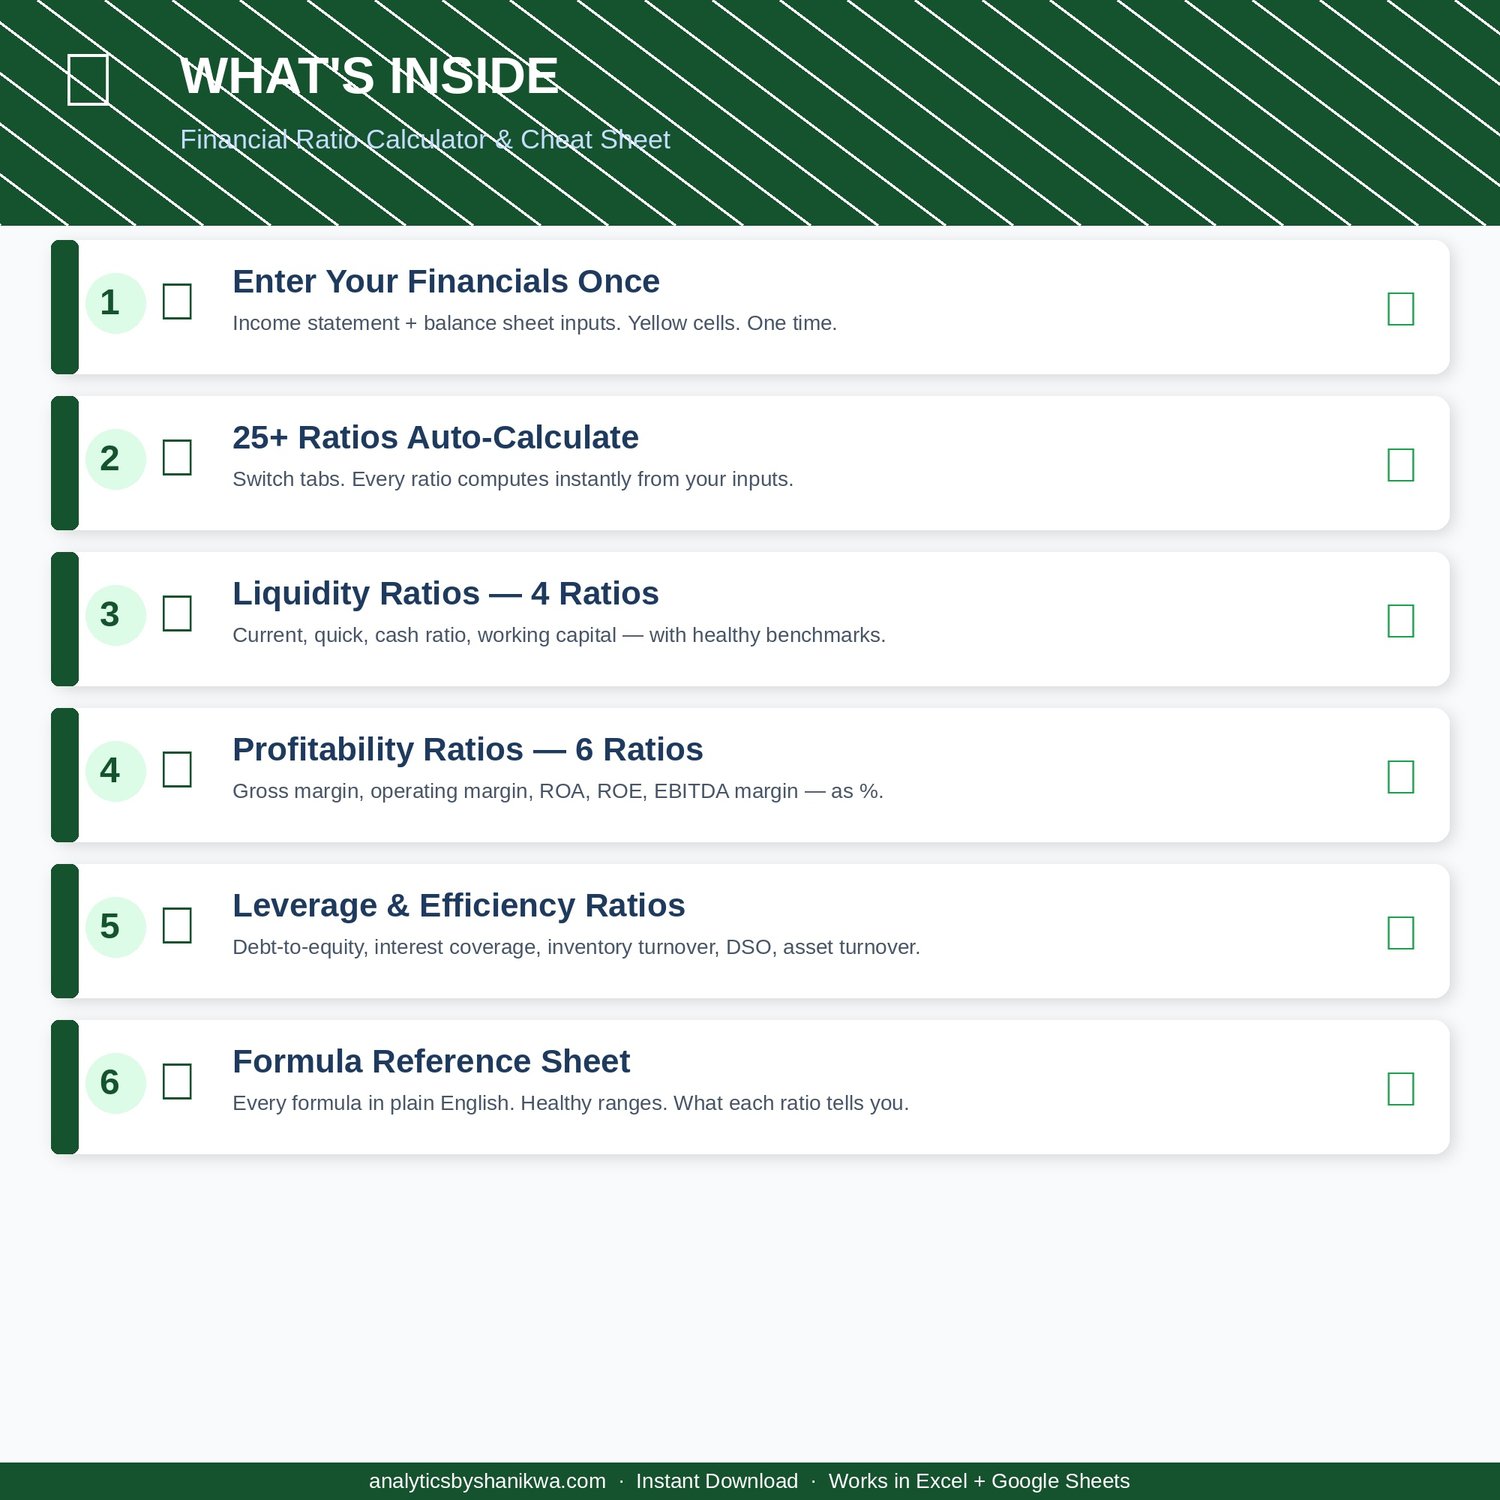
WHAT'S INSIDE — 3 SHEETS
─────────────────────────────────────────────
SHEET 1 — 📥 ENTER YOUR FINANCIALS
Yellow cells = your numbers. Green cells = auto-calculated.
Income Statement: Revenue, COGS, Gross Profit (auto), OpEx, EBIT (auto), Interest, Income Before Taxes (auto), Tax, Net Income (auto), D&A, EBITDA (auto)
Balance Sheet — Assets: Cash, Short-Term Investments, Receivables, Inventory, Other Current, Total Current (auto), PP&E, Intangibles, Total Assets (auto)
Balance Sheet — Liabilities & Equity: AP, Short-Term Debt, Other Current, Total Current Liabilities (auto), Long-Term Debt, Total Liabilities (auto), Equity (auto)
Other Inputs: Shares Outstanding, Stock Price, Enterprise Value (auto), Average Receivables/Inventory/Assets (auto from current + prior year)
Current Year AND Prior Year columns — enter both for side-by-side comparison.
SHEET 2 — 📊 CALCULATED RATIOS (25+ ratios)
LIQUIDITY (4): Current Ratio (benchmark 1.5–2.0) · Quick Ratio · Cash Ratio · Working Capital
PROFITABILITY (6): Gross Margin % · Operating Margin % · Net Margin % · ROA · ROE · EBITDA Margin
LEVERAGE (4): Debt-to-Equity · Debt-to-Assets · Interest Coverage · Debt-to-EBITDA
EFFICIENCY (5): Asset Turnover · Inventory Turnover · DIO · Receivables Turnover · DSO (30–45 days typical)
VALUATION (3): P/E Ratio · P/B Ratio · EV/EBITDA (6–10x typical)
CASH FLOW (2): Free Cash Flow · Quality of Earnings
Fifth column on every ratio: add your industry benchmark.
SHEET 3 — 📖 FORMULA REFERENCE
Every ratio. Plain-English formula. Healthy range. What it tells you.
─────────────────────────────────────────────
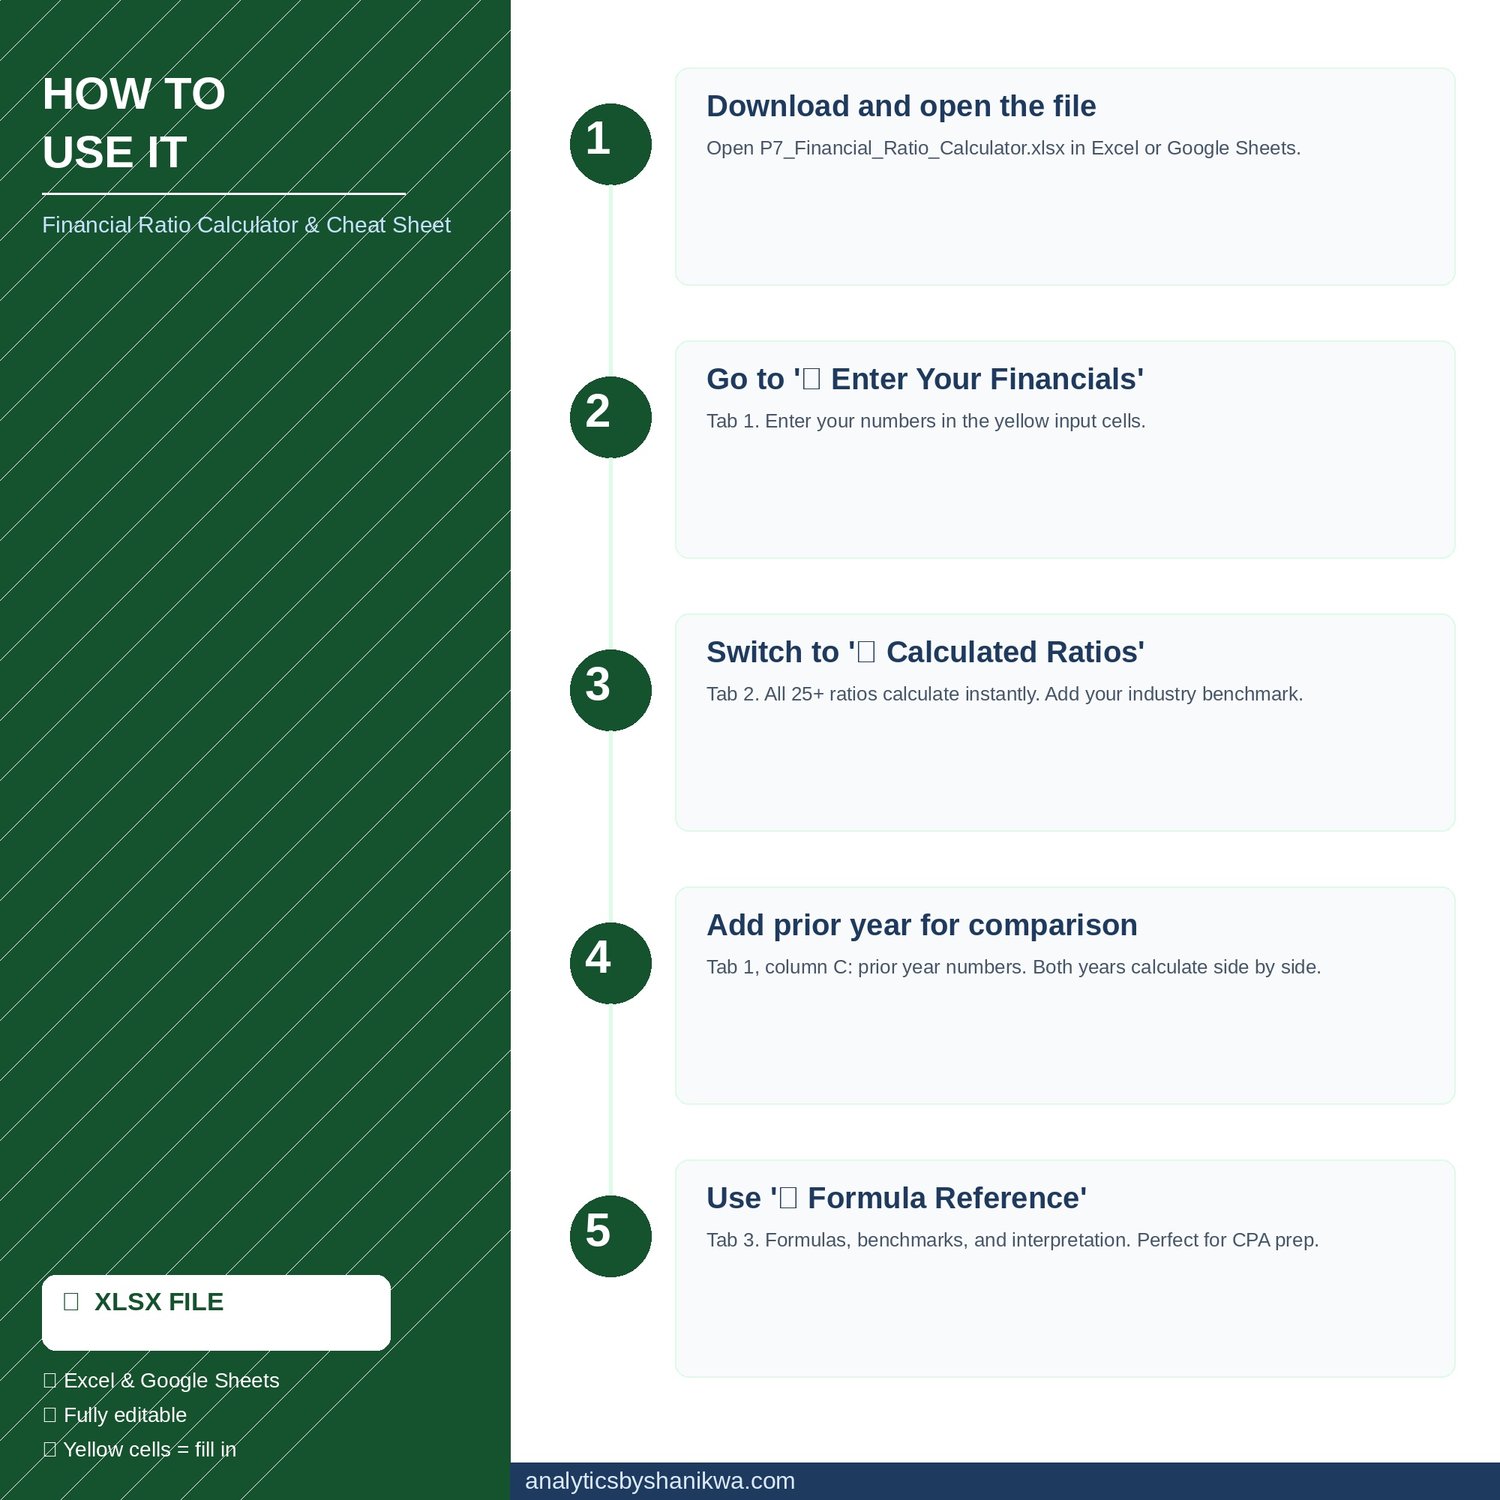
Step 1 — Open P7_Financial_Ratio_Calculator.xlsx.
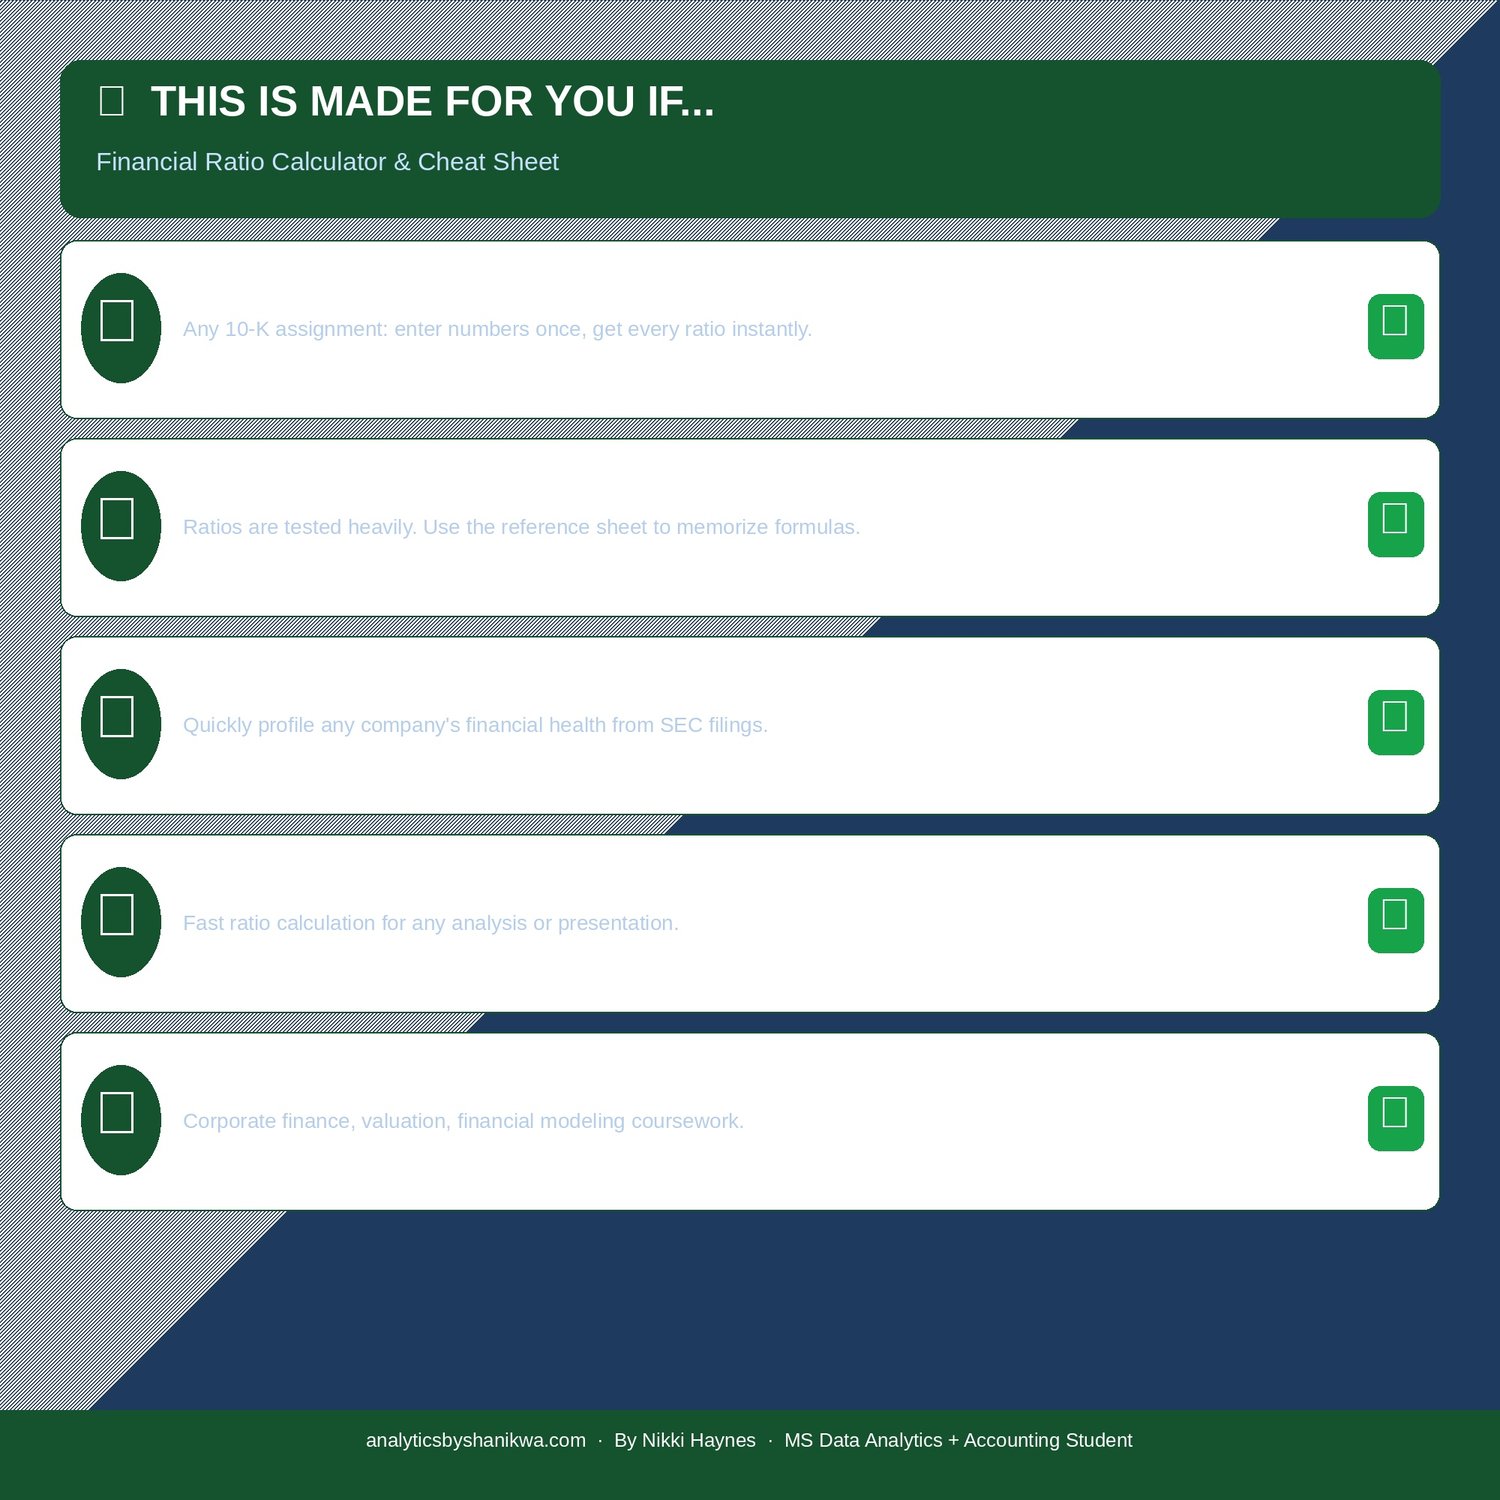
Step 2 — Tab 1: enter numbers in yellow cells (use a 10-K from SEC EDGAR).
Step 3 — Tab 2: all ratios appear instantly. Add benchmarks in column E.
Step 4 — Tab 1 prior year column: enters for year-over-year comparison.
Step 5 — Tab 3: study formulas for CPA FAR exam prep.
Do NOT delete green cells — they contain the formulas.
File: .xlsx | Compatible: Excel 2016+, Google Sheets | Delivery: Instant
Questions? Message me — 24-hour response. ⭐ Also in the Accounting Student Bundle ($25).