
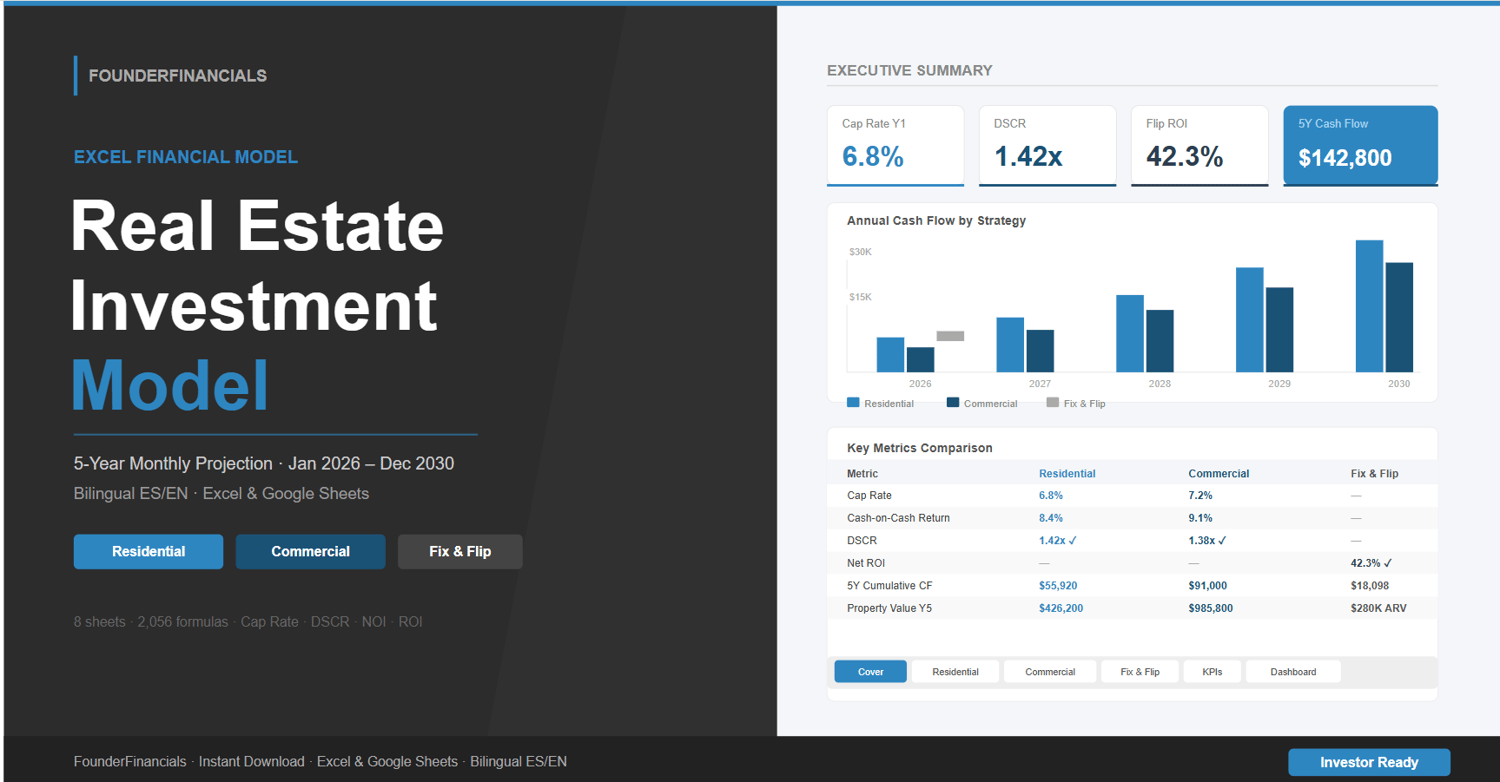
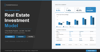
Real Estate Investment Model Excel — Residential, Commercial & Fix and Flip | 5-Year Monthly Analysis | Bilingual ES/EN
Analyze residential rentals, commercial NNN leases, and fix & flip deals in one professional Excel model. 60 monthly periods (Jan 2026 – Dec 2030), 8 automated worksheets, 2,056 formulas, and an investor-ready dashboard. Bilingual ES/EN. Just change the yellow cells — everything else calculates automatically. Compatible with Excel and Google Sheets.
This model is designed for real estate investors, property analysts, and financial advisors who need a comprehensive tool to evaluate three different investment strategies in a single file — without building separate models for each property type.
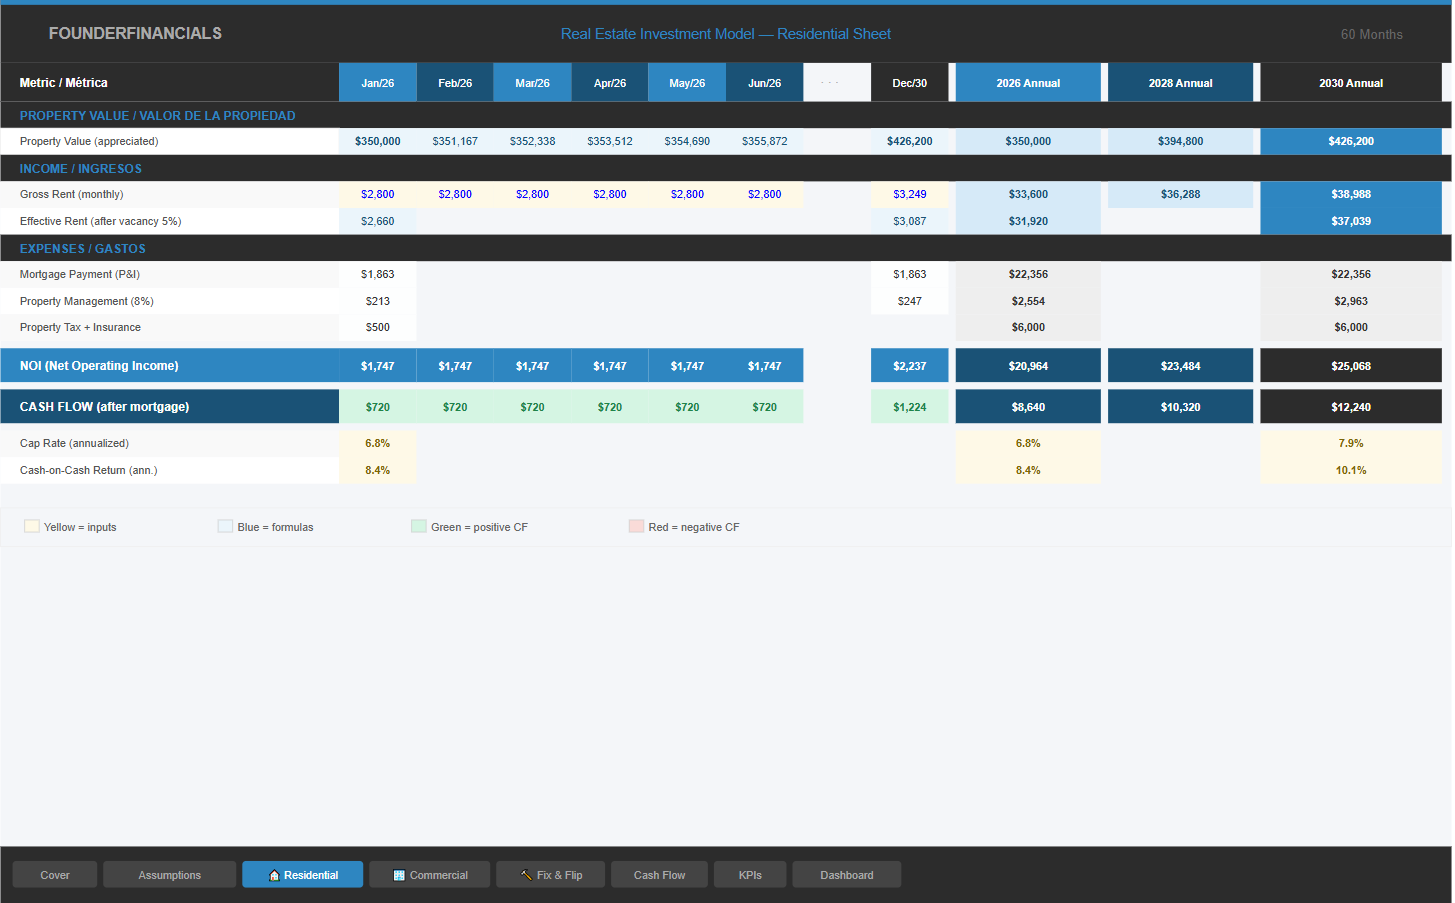
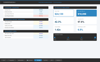
The Residential module projects monthly rental income, vacancy adjustments, mortgage payments (P&I), property management fees, maintenance costs, property tax, and insurance across 60 periods. It automatically calculates NOI, cash flow, cap rate, and cash-on-cash return.
The Commercial module handles NNN lease structures with base rent escalation, vacancy rates, operating expense ratios, and DSCR (Debt Service Coverage Ratio) — the key metric lenders and investors require for commercial deals.
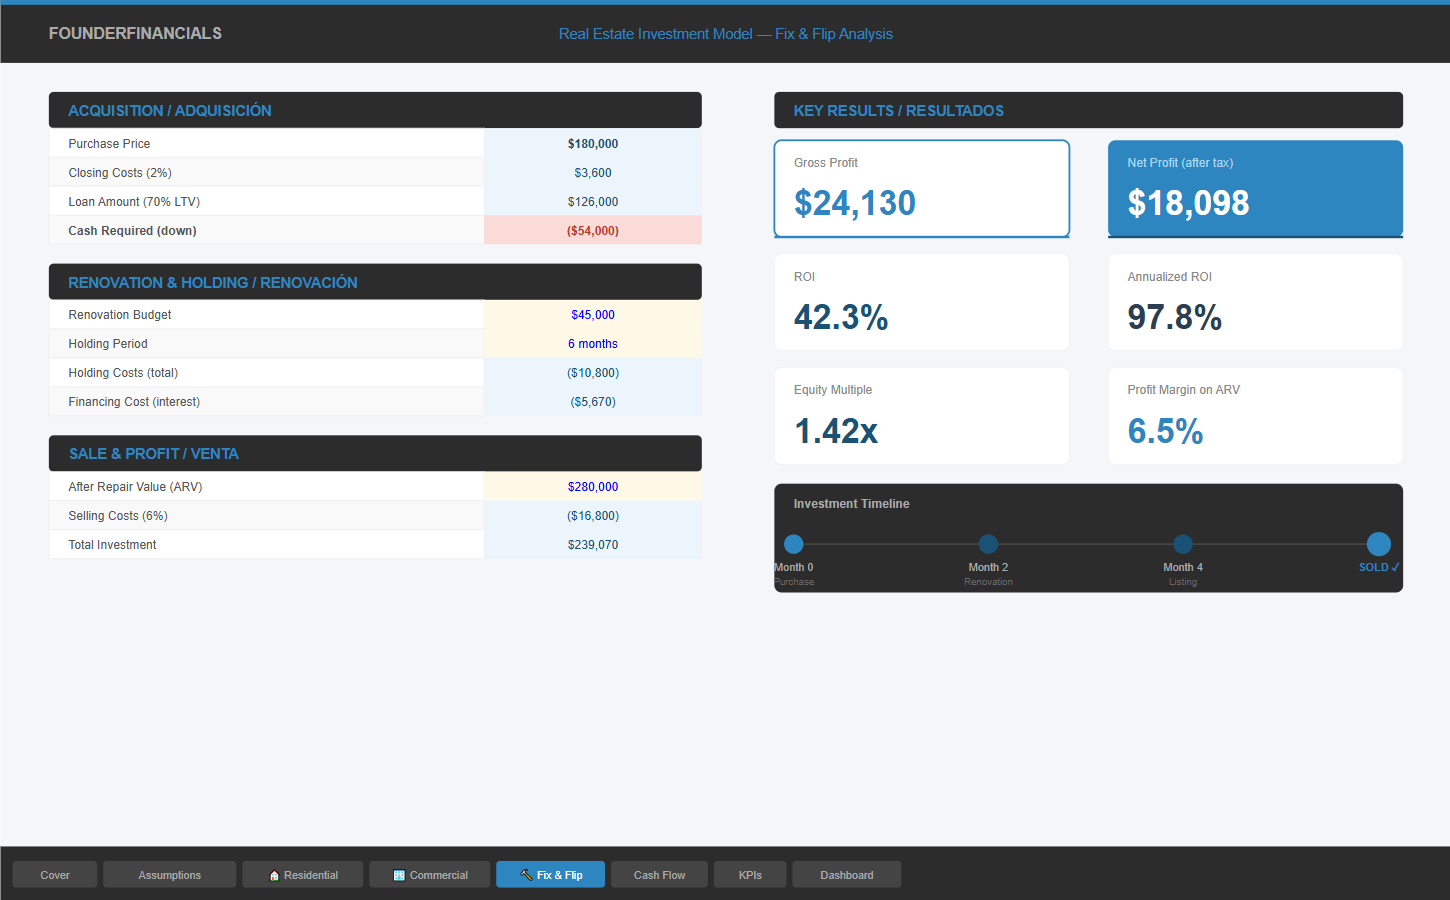
The Fix & Flip module calculates total acquisition cost, renovation budget, holding costs, financing interest, net sale proceeds, gross and net profit, ROI, annualized ROI, equity multiple, and profit margin on ARV — all in a clean, easy-to-read format.
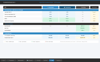
The consolidated Cash Flow sheet combines all three strategies into one monthly view, showing cumulative cash position and total investment returns over 5 years.
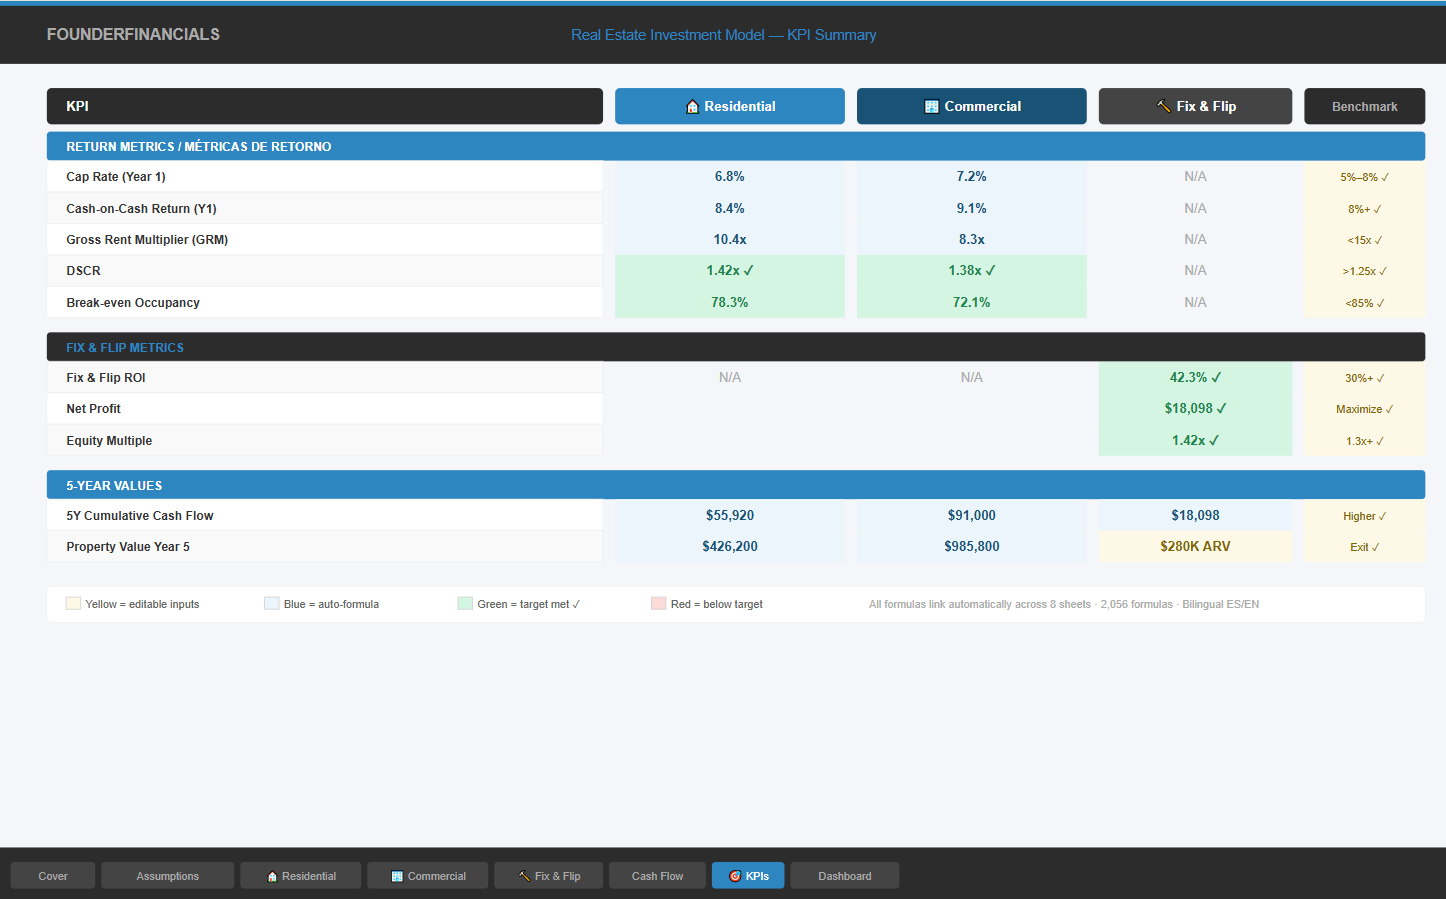
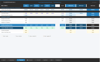
The KPI Dashboard provides an executive summary with 4 key metric cards and an annual bar chart comparing performance across strategies — ready to present to partners or lenders.