

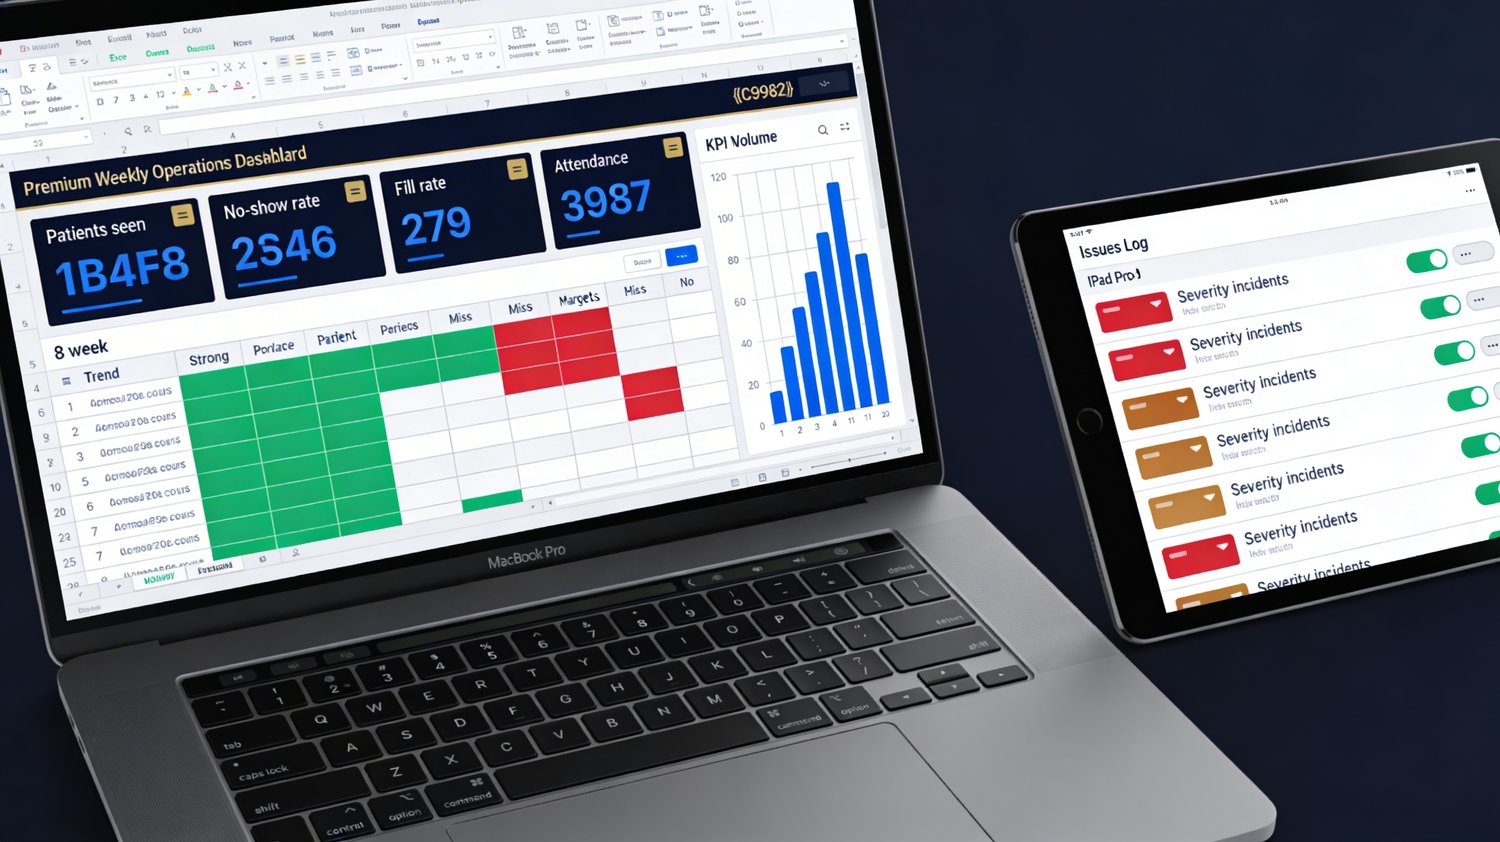


Weekly Operations Dashboard
On Sale
€24.00
€24.00
Know exactly how your clinic performed this week — without building a single formula.
This dashboard gives clinic managers a real-time view of 8 key operational metrics that update automatically every time you add a weekly row.
What's inside:
- 📊 Live Dashboard — 4 KPI metric cards + 8-week trend table, colour-coded red/green automatically
- 📅 Weekly Log — One row per week captures 14 data points: patients, no-shows, fill rate, wait time, attendance, issues, incidents, and more
- 🎯 KPI Targets tab — Edit your targets once, thresholds flow everywhere automatically
- 📈 Auto-updating charts — Patient volume bar chart + no-show vs fill rate line chart
- ⚠️ Issues Log — Log issues with severity (Critical/High/Medium/Low), root cause, status, and resolution
- 👥 Staff Attendance Tracker — Daily status per team member with colour-coded Present/Absent/Late/WFH
5 weeks of sample data pre-loaded so the dashboard displays immediately on download.
✔ Works in Google Sheets and Excel
✔ 140 pre-built formulas — zero manual calculation
✔ English version included · Spanish version available on request