


Pi-Day 2026 Bundle
Check Out the Pi-Day 2026 Special Website
TS-PortfolioMerge (1.13.1) for TradeStation and MultiCharts
BONUS: 10+ Free Trading Systems for TS-PortfolioMerge and TS-ParamScape
Trend-following and mean reversion systems included
Download the .ELD and .TSW files, import the .ELD first, and then open the .TSW workspace in TradeStation.
TS-PortfolioMerge combines multiple TradeStation or MultiCharts strategy results (.xml) into one clean portfolio view, so you can evaluate total equity, drawdowns, and portfolio behavior at a glance. No Python required. Simple Windows installer included.
Check out the new website for the product - TS-PortfolioMerge Version 1.13.1 Website
Combines multiple TradeStation/MultiCharts strategy results (.xml) into one clean portfolio view—showing total equity and drawdowns at a glance. Simple installer, no Python required. User Manual included.
What it does
TS-PortfolioMerge builds a single, combined equity curve from multiple strategy/market results exported from TradeStation or MultiCharts—so you can see the “whole portfolio” performance in seconds.
Who it’s for
Traders and system developers who want a quick, reliable way to merge strategy outputs and visualize total equity and drawdowns without spreadsheets.
Key features
- 🔗 Merge multiple results (strategies/markets) into one portfolio equity curve
- ⚡ m-out-n subset selection — pick any m strategies out of n candidates and preview the combined equity fast, making it easy to compare different mixes
- 📈 Daily equity & drawdown visualization to spot regime shifts quickly
- 🧾 Per-file breakdown so you can see each component’s contribution
- 🌓 Use a companion Strategy in a Study Group to automate (sort of ) data extraction
- 📘 User Manual (PDF) installed with the app
What you get
- Setup ZIP containing the Windows installer
- Install Guide (PDF) with step-by-step instructions
- User Manual (PDF) installed to: Start → TS-PortfolioMerge → User Manual
TS- ParamScape Suite (3D and Rank) (Windows)
Visual parameter analytics for TradeStation/MultiCharts. Visualize the entire search space, rank impact, and pick robust settings fast. Simple installer, no Python required. User Manuals included.
What it does
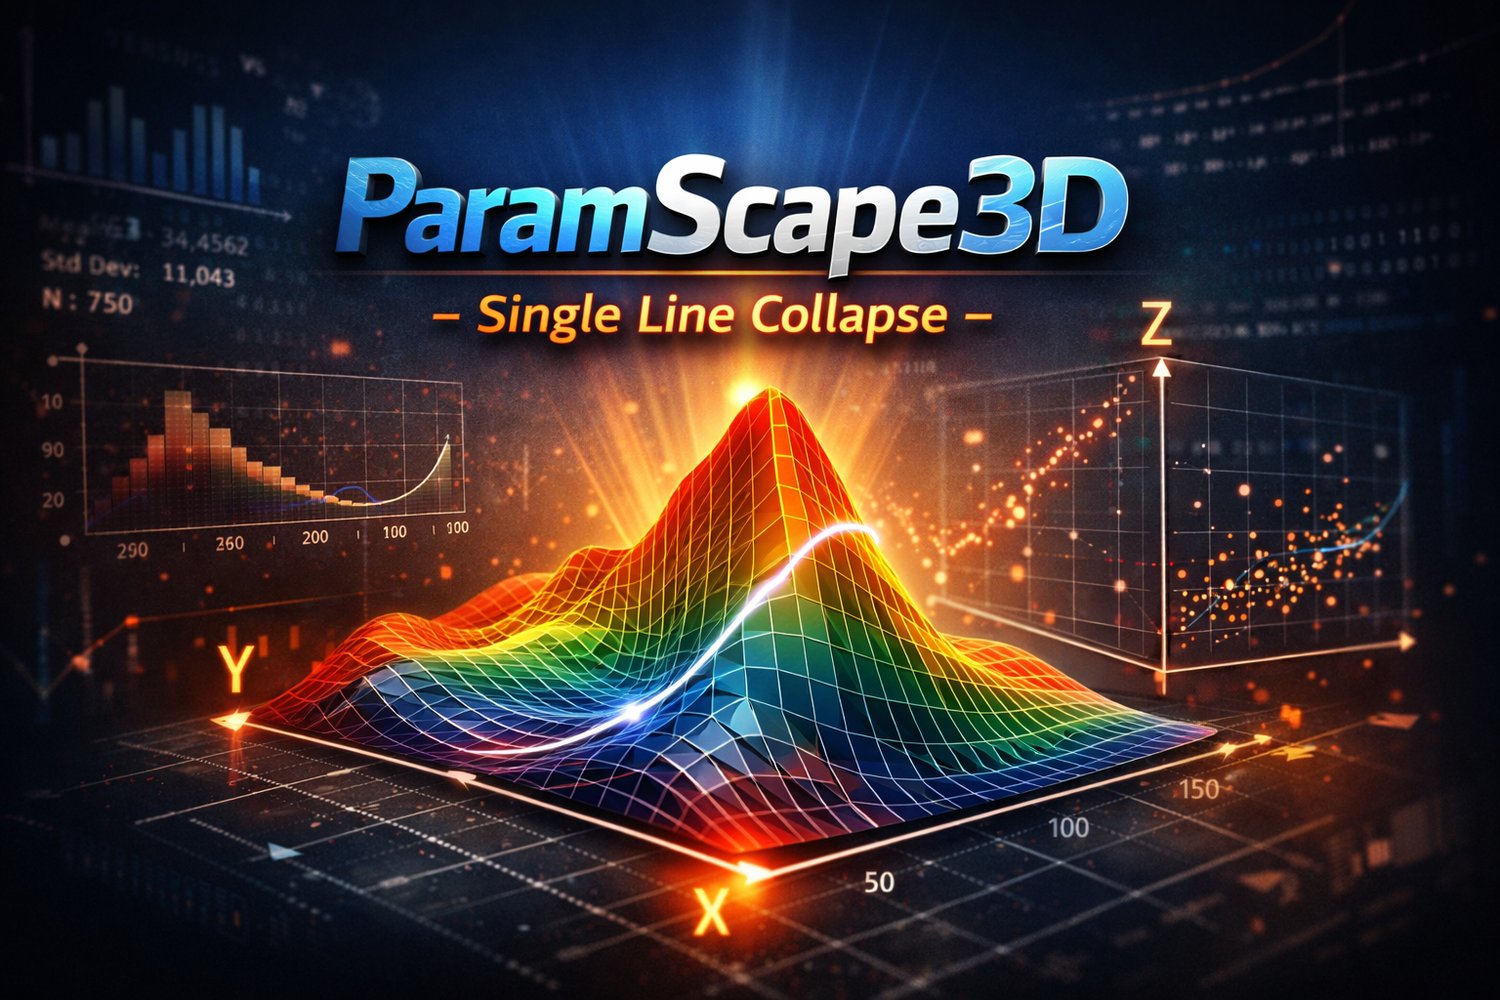
TS-ParamScape3D renders 3D/interactive surfaces and volumetric scatters so you can see plateaus, ridges, and “knees” across the full Param1 × Param2 grid while aggregating over other parameters.
TS-ParamScapeRank quantifies each parameter’s impact (Random Forest), shows trend/monotonicity, and detects knee/elbow and plateau regions on 1-D profiles—so you avoid brittle spikes.
Who it’s for
Traders and system developers who optimize 2+ parameters and want to choose settings that generalize—before walk-forward testing—using TradeStation/MultiCharts optimization exports.
Watch a quick video on TS-ParamScape
Key features
- 🗺️ 3D surfaces & volumetric scatter — visualize thousands of runs at once (Matplotlib + Plotly).
- 📊 Impact ranking (RF) — identify high-leverage parameters quickly.
- 📈 1-D profiles — trend/monotonicity, knee/elbow (diminishing returns), and plateau score (0..1).
- 🧮 Aggregate across extra dims — collapse 3rd/4th… parameters (mean over all iterations) so you see plateaus that persist.
- 🗂️ Smart file handling — reads tab with parameters before Test (or, if no Test, before first Net…), metrics after.
- 🌐 Interactive Plotly — opens in your default browser; export PNG/HTML for reports.
- 🌓 Clean, high-contrast UI — built for readability in screenshots and videos.
- 📘 User Manuals included; no Python required.
What you get
- Setup ZIP containing the TS-ParamScape Suite Windows installer
- User Manuals (PDF) for 3D and Rank (installed to Start Menu)
- Optional sample optimization files (if you include them)
Install (Windows)
- Download the Setup ZIP from your PayHip purchase page.
- Right-click the ZIP → Extract All…
- Open the folder and double-click TS-ParamScapeSuite-Setup.exe.
- After install: launch from Start → TS-ParamScape3D or TS-ParamScapeRank.
- If Windows SmartScreen appears, click More info → Run anyway.
Requirements
- Windows 10/11 (64-bit)
- Default web browser (for Plotly interactive views)
- No Python or extra software required
Watch a quick video on TS-ParamScape
ParamScape Single Line Collapse Video
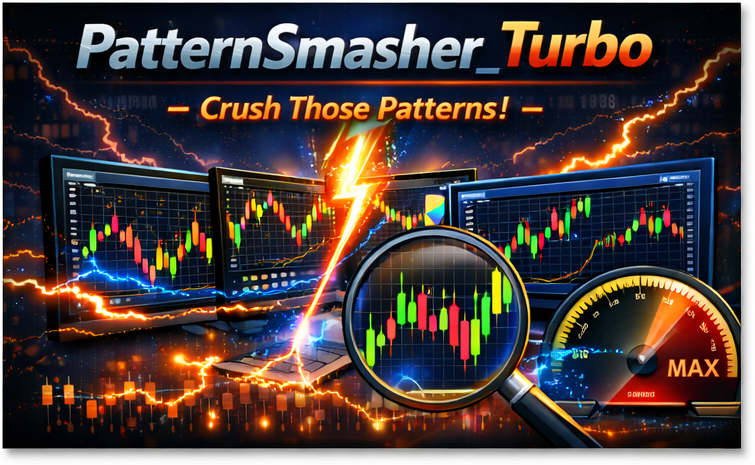
Pattern Smasher 2025 (sneak peek at Turbo)
- Doesn’t just test one pattern – it opens up an entire universe of them.
- You define up to eight True/False conditions in EasyLanguage – they can be candles, indicator crossovers, volatility filters, regime flags, time-of-day, whatever you want. PatternSmasher encodes those into multi-bar binary patterns and then exhaustively tests what happens after every pattern that actually occurs in your data.
- With the built-in masking technology, you’re not limited to one “perfect” pattern definition. You can switch individual conditions on or off and instantly roll many detailed patterns up into broader families. Want to know how all patterns behave where the last three conditions are true, regardless of what happened earlier? Mask out the early bits and PatternSmasher shows you the combined stats. Zoom in for highly specific setups, or zoom out to see big-picture tendencies – without rerunning a single test.
- The result is a playground for pattern research. You can explore short-term continuation vs. reversal, strong closes after volatility expansions, behavior after gaps, trend-vs-range regimes, long-only vs. short-only patterns, and much more – across any market and timeframe you can chart in TradeStation or MultiCharts. Instead of arguing about which setup “looks good,” PatternSmasher 2025 lets you map and measure an entire landscape of patterns and their forward returns, all from simple True/False formulas you already know how to write.
- PatternSmasher-2025 includes
- PatternSmasher_2025_Match - Strategy : Match exact pattern or optimize all combinations of a pattern
- PatternSmasher_2025_AllMasks - Indicator : Output csv file of all Patterns and their associated Masks
- PatternSmasher_2025_Match_AI - Strategy : Formula are expressed as variables so you can modify them internally without worrying about Inputs.
- PatternSmasher_2025_AllMasks_AI - Indicator : Formula are defined inside the code...
- 45 page manual
- Automatic enrollment in PatternSmasher Lab : Updated research and upgrades performed by George once per month
Easing into EasyLanguage Academy Module #4
Algorithm Detective Work Begins Here
Join George as he performs a post-mortem on a trading algorithm that once showed real promise but now finds itself in the morgue.
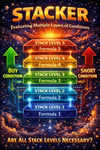
Meet STACKER — an ambitious multi-layer algorithm from the 2000s that once looked like it had a future. But time, changing market behavior, and deeper analysis have raised the big question:
Can it be reanimated?
In this module, George digs into the original logic, examines how the system behaved before and after release, and uses modern analysis tools to determine whether the algorithm still has technical merit — or whether it should remain buried.
This is not a system-development exercise. It is a forensic investigation into what made the algorithm work, what caused it to deteriorate, and whether some of its parts still contain life.
Includes
- 25-page manual detailing the source code, design logic, and pre- and post-release performance metrics
- 1-hour video showing how George uses ParamScape and PatternSmasher to dissect the algorithm and search for surviving edges
- A real-world case study in trading system analysis, degradation, and possible rehabilitation
What you’ll learn
- How to perform a post-mortem on a trading strategy
- How to separate genuine edge from historical success
- How to examine which parameters and logic layers mattered most
- How modern tools can help determine whether an old strategy deserves another look
This module is ideal for traders and system developers who want to go beyond blind optimization and learn how to investigate an algorithm like a detective.