

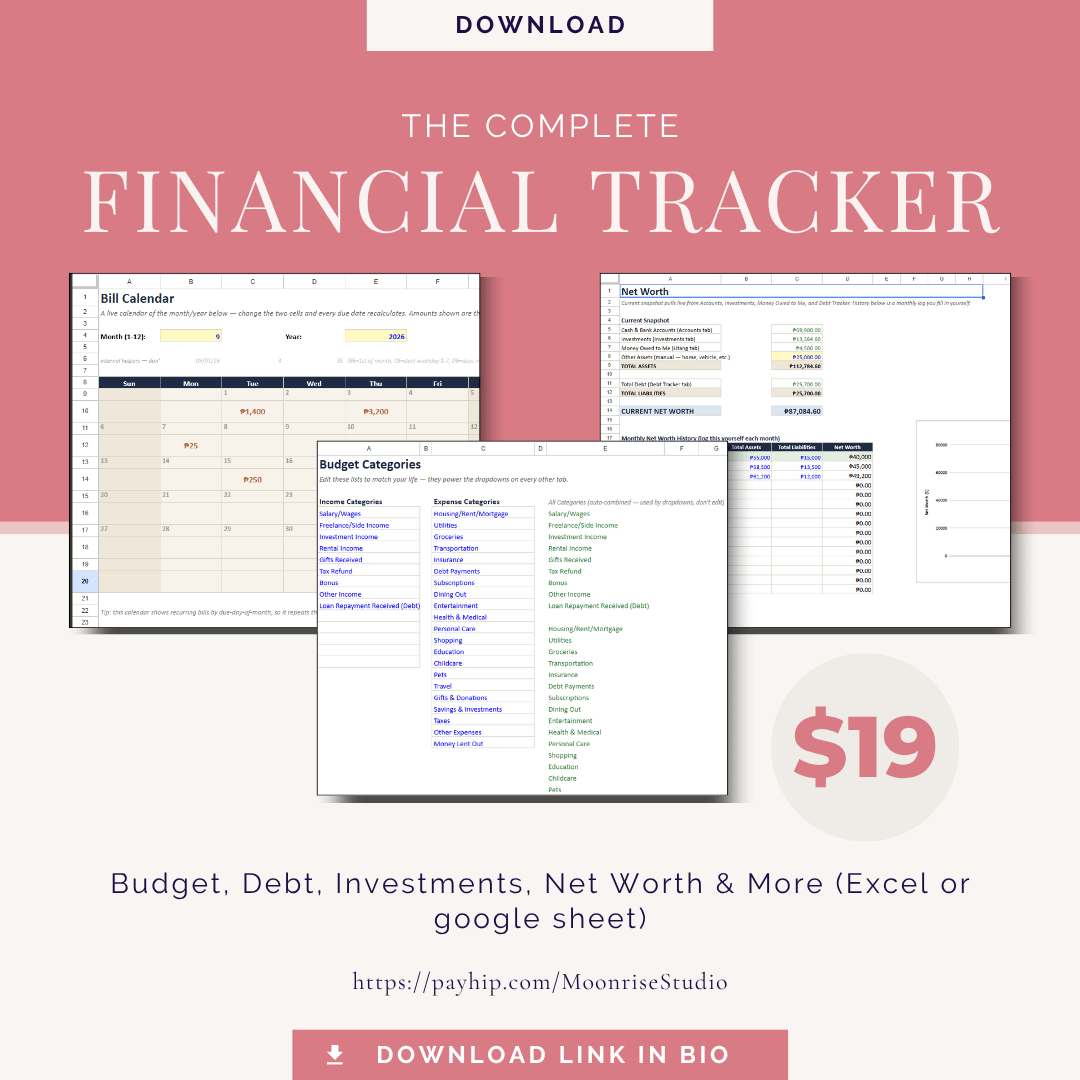
The Complete Financial Tracker — Budget, Debt, Investments & Net Worth (Excel)
Thirteen spreadsheets. One real system. Zero guesswork.
Most budget templates give you one tab and a prayer. The Complete Financial Tracker gives you an entire financial command center — every number connected, every chart live, every formula actually working.
What's inside:
📊 Dashboard — 4 live charts: spending by category, income vs. expenses, investment allocation, and net worth over time
💰 Budget Categories — fully customizable income & expense categories that power every dropdown in the workbook
🏦 Accounts — checking, savings, credit cards, and cash, all in one place
📝 Transactions — a full yearly log that automatically feeds your budget and charts
📈 Monthly Budget — budget vs. actual, by category, by month, with annual totals calculated automatically
💼 Investments — track holdings across 401(k), Roth IRA, RRSP, TFSA, PPF, NPS, PGBL, Superannuation, and more — built for a global audience, not just one country's retirement accounts
💳 Debt Tracker & Payoff Calculator — real Avalanche and Snowball ranking formulas, with a live calculator showing exactly how extra payments accelerate your debt-free date
🤝 Money Owed to Me — a dedicated tracker for money you've lent out, so it doesn't disappear from your net worth just because it's not sitting in your bank account
🔔 Bills & Income + a live Calendar — recurring bills with a genuinely dynamic monthly calendar view showing what's due and when
🎯 Savings Goals — target amounts, deadlines, and the exact monthly contribution needed to hit them
📉 Net Worth — a live snapshot plus a monthly history log with its own chart
Built for real use, not just a demo:
- Every number is a working formula, not a static value — change one number and watch the whole workbook update
- Color-coded: blue = your inputs, green = automatic links, yellow = key numbers worth double-checking
- Sample data throughout shows you exactly how to use it — delete it and drop in your own numbers
Best viewed in Google Sheets: this template works in both Excel and Google Sheets, but the Dashboard's live charts render more cleanly in Google Sheets — if you want the smoothest dashboard experience, we recommend uploading it there (File → Import in Google Sheets, or just drag the file into Google Drive and open it) rather than viewing it in Excel.
Two honest notes: this template doesn't pull live stock prices (that requires a paid API/backend no spreadsheet can provide) — instead it uses a simple manual "current price" field you update whenever you check your portfolio. And "dark mode" / cross-device sync are your Excel app's own settings, not something a file controls — this works in Excel, Google Sheets, or Excel Online either way.
📥 Instant download — .xlsx file, works in Excel, Excel Online, and Google Sheets (upload and it converts automatically).
creations for you ✨