



E-commerce Inventory & COGS Tracker
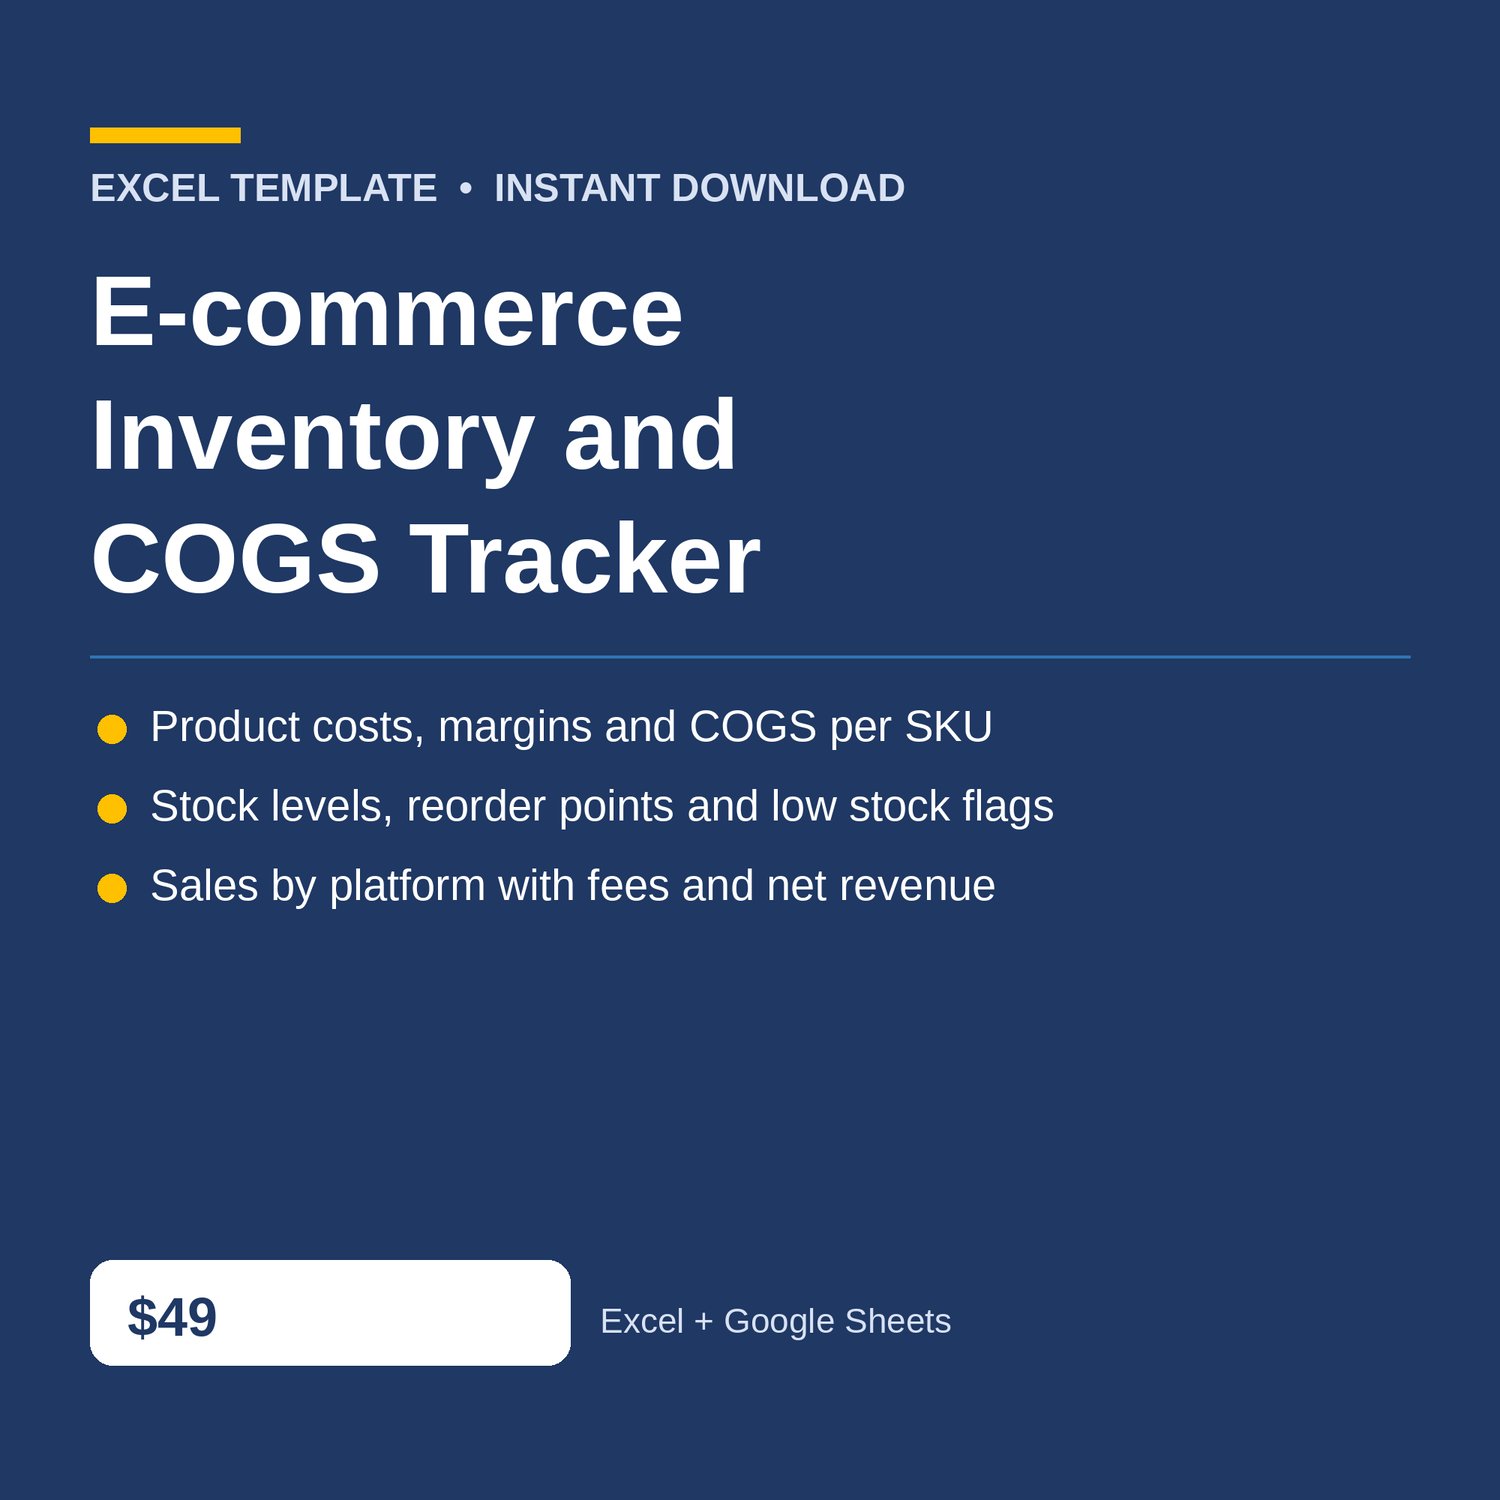
Ecommerce Inventory and COGS Tracker Excel with product margins per SKU, stock levels and reorder points, sales by platform with fees, and a monthly P and L dashboard. Know what every product actually costs, what you have left, and what every platform actually pays you after fees.
Built for Amazon, Etsy, and Shopify sellers who need to know, product by product, whether the price covers the cost, the shipping, and the platform fee — without accounting software. If a product is losing money after fees, or a bestseller is about to run out, this workbook flags it before the next order.
WHAT'S INCLUDED (6 sheets):
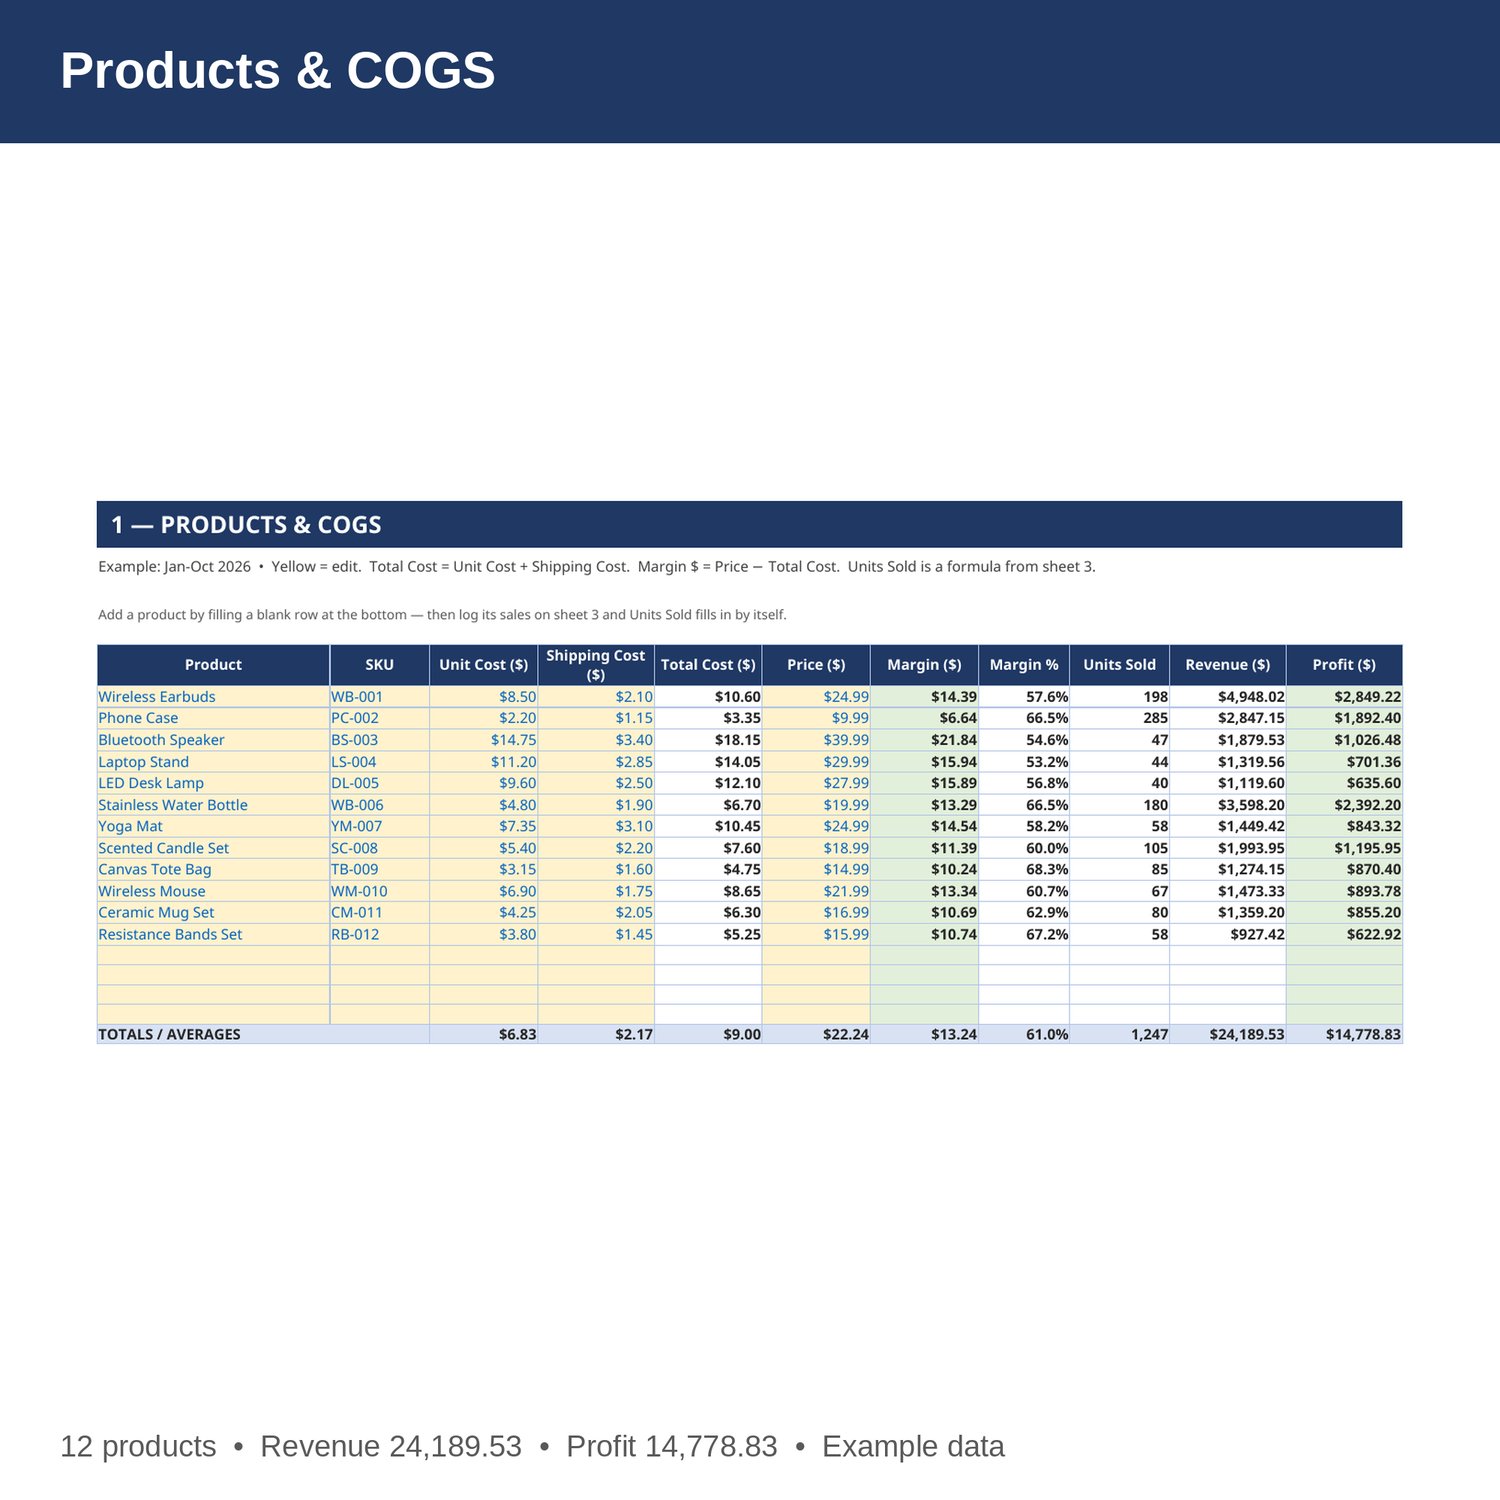
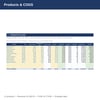
- Products and COGS — product, SKU, unit cost, shipping cost, total cost, price, margin in dollars and percent, units sold, revenue, and profit. Units sold is a formula from the Sales log, so product revenue and profit always tie to your sales rows. Products with a margin under 20 percent are flagged.
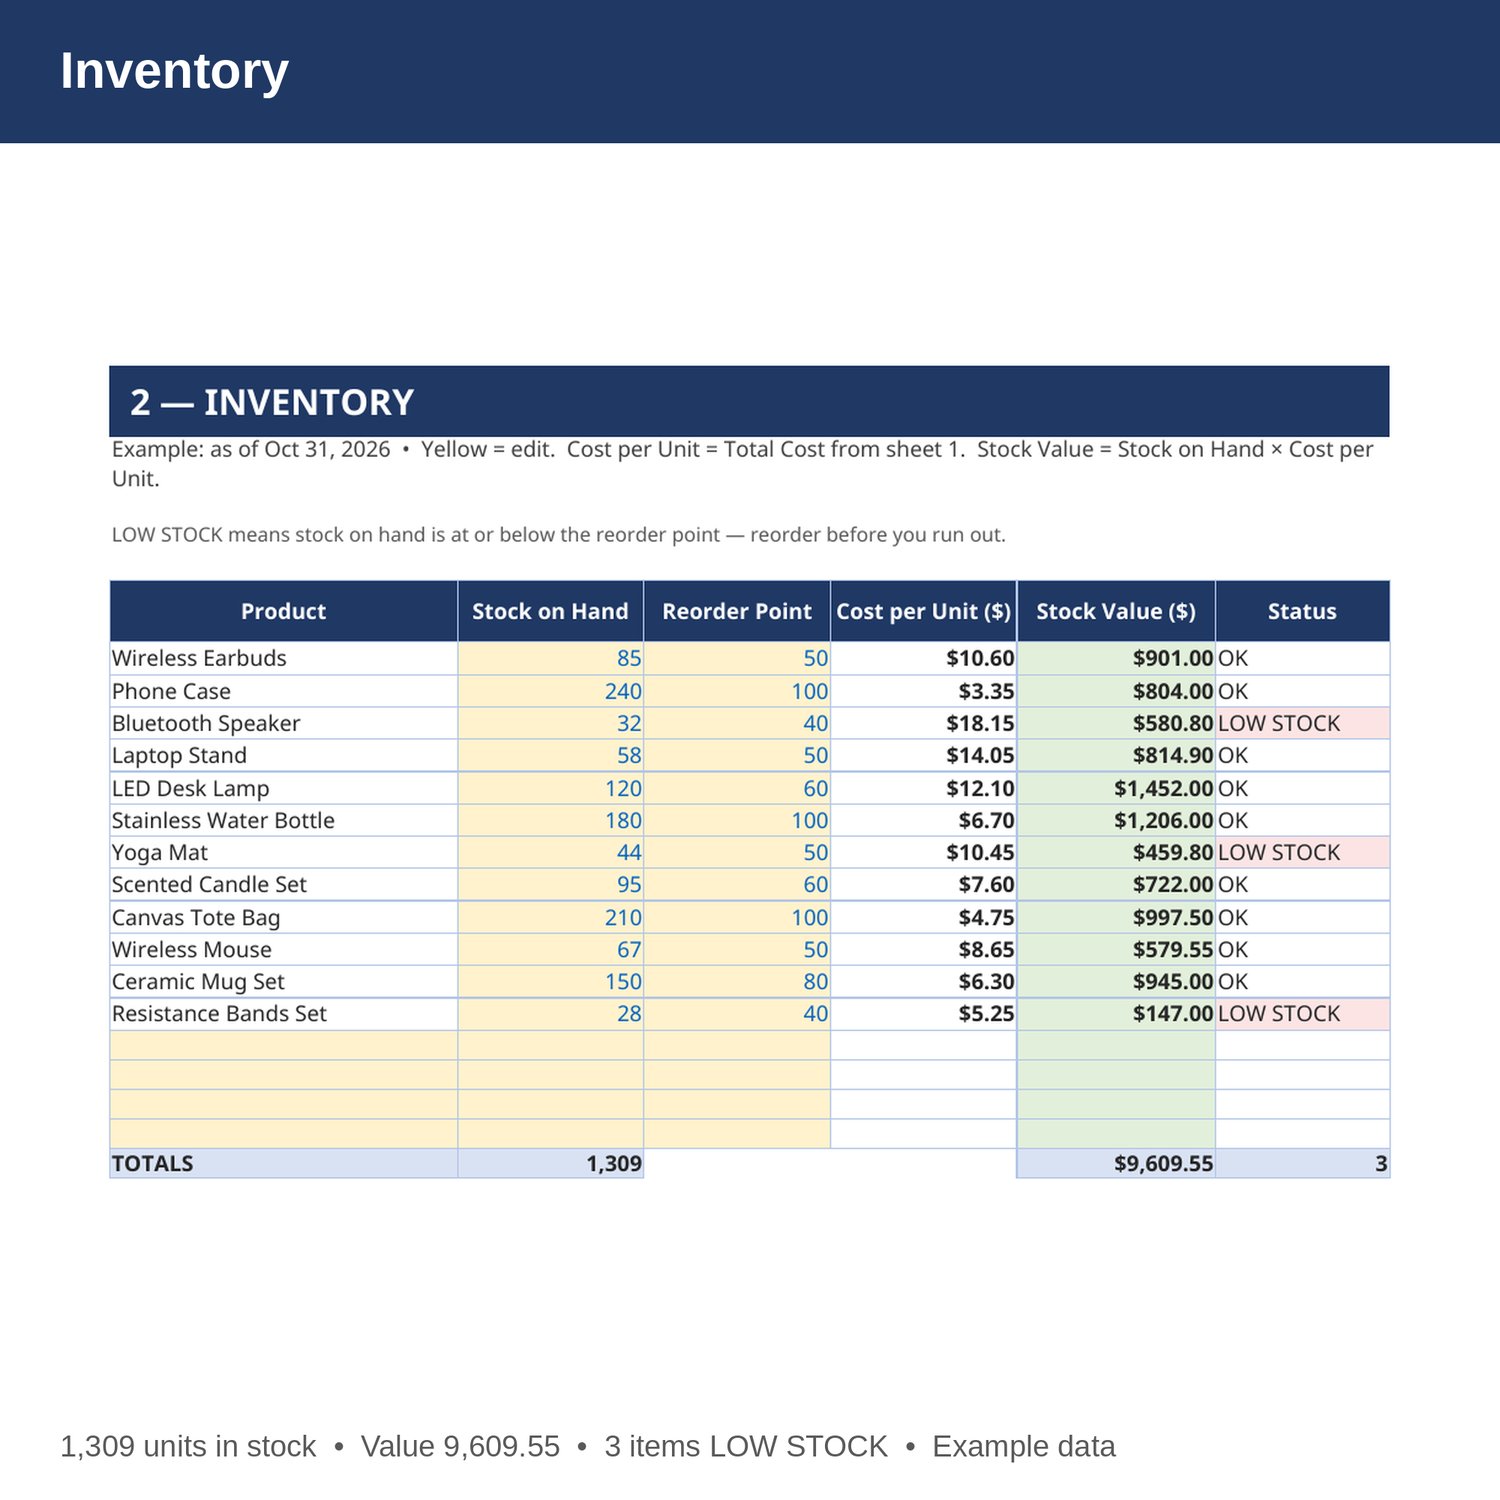
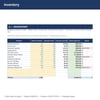
- Inventory — stock on hand, reorder point, cost per unit, and stock value for every product. Stock at or below the reorder point is flagged LOW STOCK.
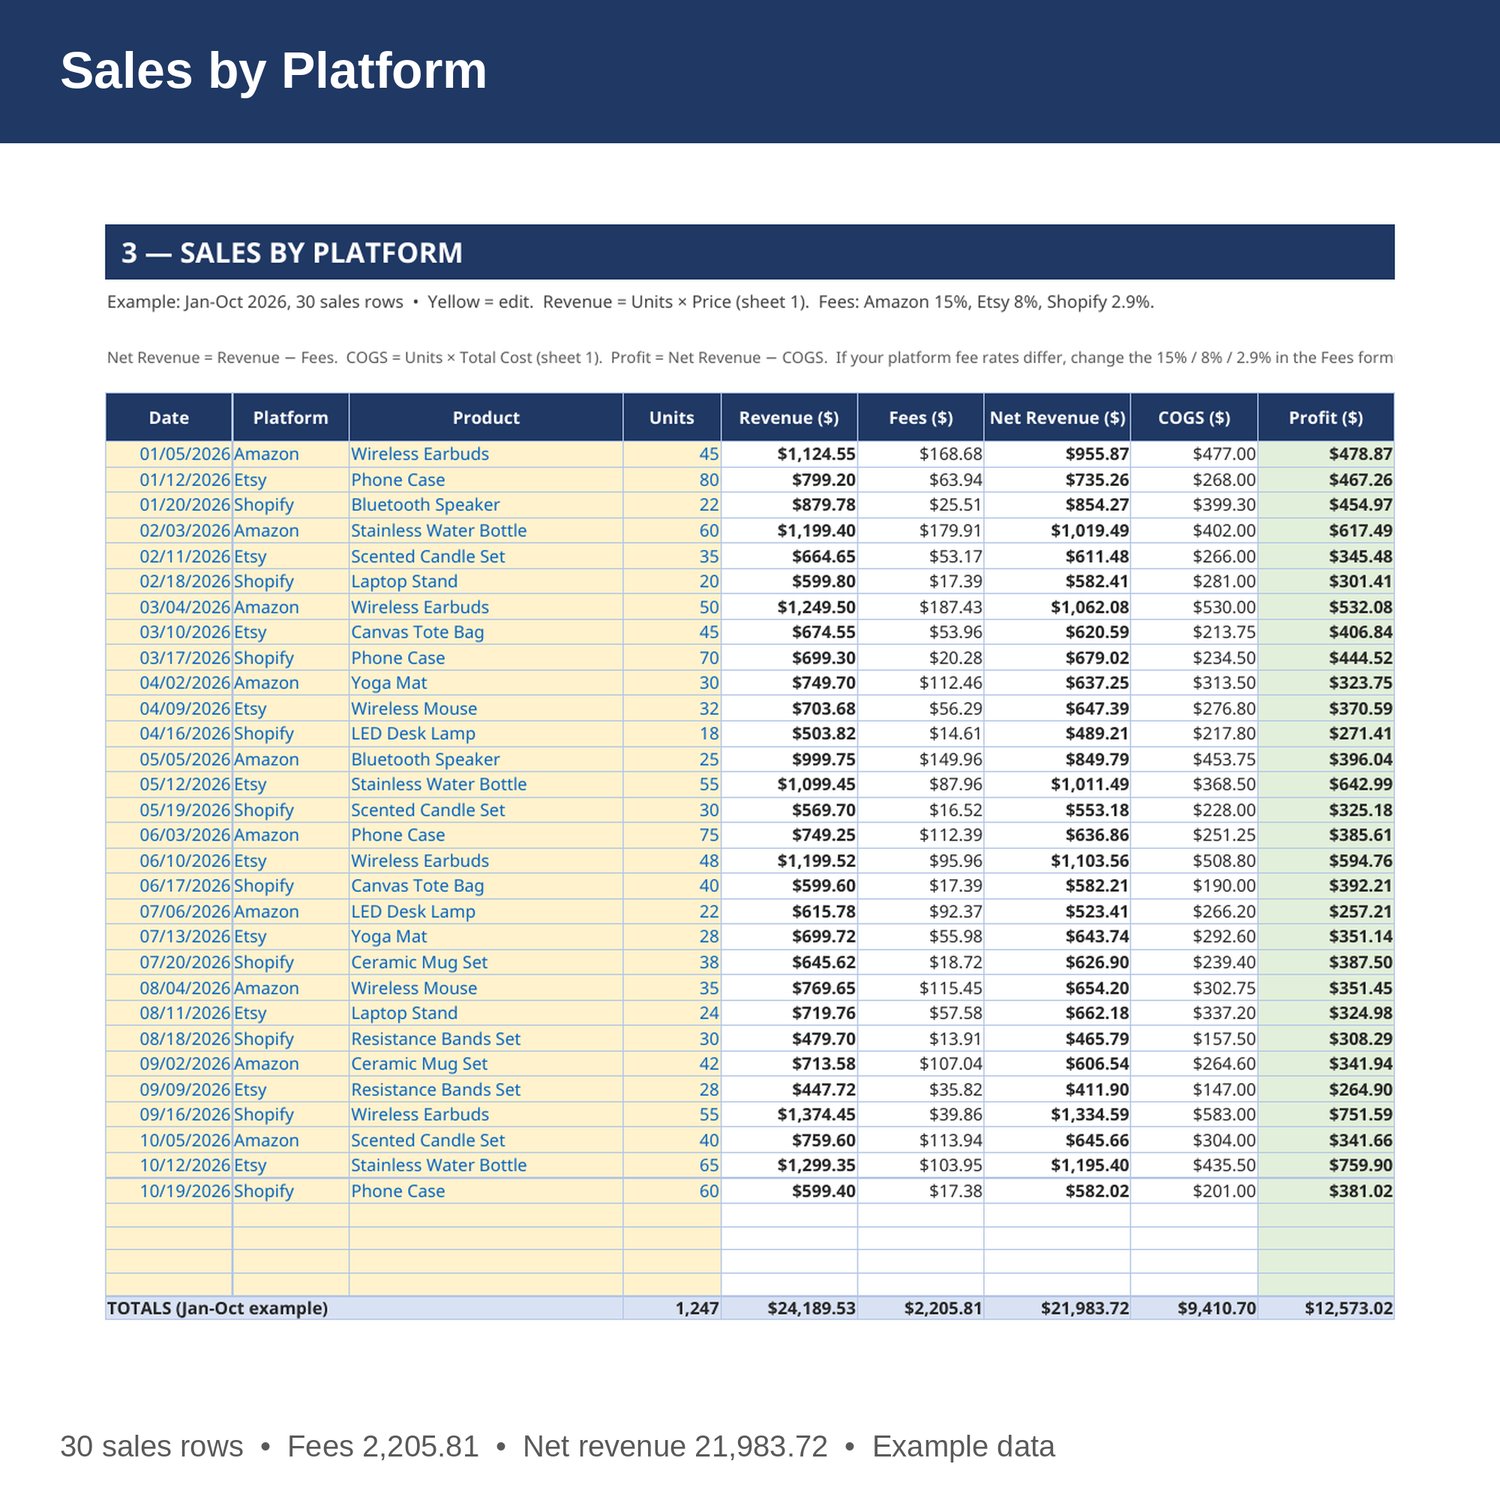
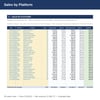
- Sales by Platform — date, platform, product, units, revenue, fees, net revenue, COGS, and profit for every sale. Fees are 15 percent on Amazon, 8 percent on Etsy, and 2.9 percent on Shopify. Change the rates in the Fees formulas if your rates differ.
- Monthly P and L — revenue, COGS, fees, and other expenses by month, Jan-Dec, with net profit and margin. All formulas from the Sales sheet, except Other Expenses, which you enter per month.
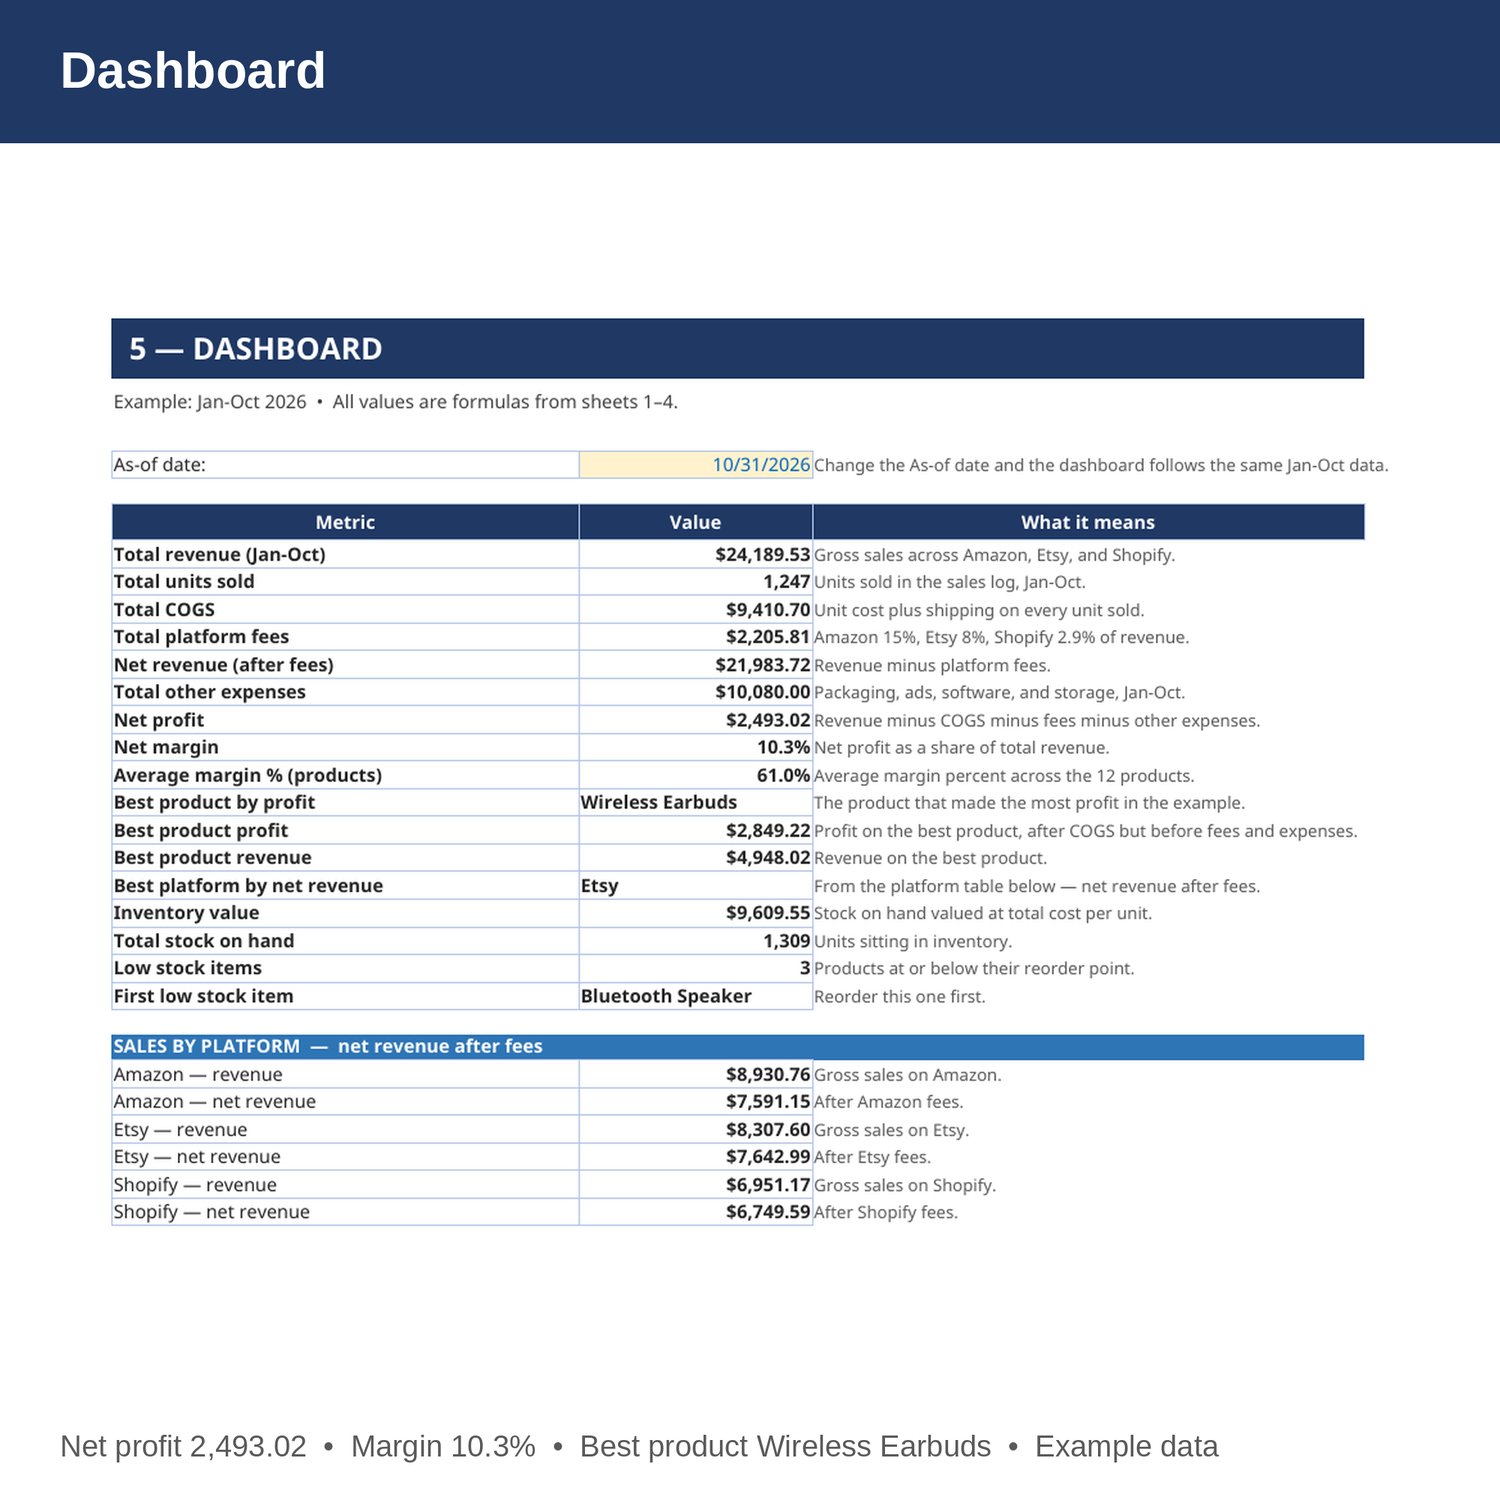
- Dashboard — total revenue, COGS, fees, net profit and margin, best product, best platform, inventory value, and low stock count, plus a sales-by-platform table with revenue and net revenue per platform.
- Cover and How to Use — start here. Yellow cells are the only ones you edit.
EXAMPLE DATA (Jan-Oct 2026 — replace with your own numbers):
- Total revenue 24,189.53 from 1,247 units sold; total COGS 9,410.70; total platform fees 2,205.81; net revenue after fees 21,983.72.
- Profit after fees and COGS is 12,573.02. Other expenses 10,080. Net profit 2,493.02; net margin 10.3 percent.
- Best product by profit: Wireless Earbuds, 198 units, revenue 4,948.02, profit 2,849.22, margin 57.6 percent. Phone Case sold the most units (285) at 66.5 percent margin. Average margin across all 12 products is 61.0 percent.
- Best platform by net revenue: Etsy, net 7,642.99 on revenue 8,307.60. Amazon has the most gross revenue (8,930.76) but its 15 percent fee leaves net 7,591.15, just below Etsy. Shopify: revenue 6,951.17, net 6,749.59.
- Inventory in the example: 1,309 units on hand, stock value 9,609.55. 3 items are LOW STOCK: Bluetooth Speaker (32 on hand, reorder point 40), Yoga Mat (44, reorder point 50), and Resistance Bands Set (28, reorder point 40).
- Best month: January, profit 551.10 on revenue 2,803.53, margin 19.7 percent. July and August are negative in the example (minus 104.15 and minus 65.28) because other expenses outran slow sales months — the sheet shows a bad month honestly.
HOW IT WORKS:
1. Download the Excel file instantly after purchase.
2. On sheet 1, enter each product's unit cost, shipping cost, and price. Total cost, margin, revenue, and profit calculate by formula.
3. On sheet 2, enter stock on hand and a reorder point per product. Cost per unit and stock value fill in by formula.
4. On sheet 3, log every sale: date, platform, product, and units. Revenue, fees, net revenue, COGS, and profit fill in by formula.
5. On sheet 4, enter Other Expenses per month (packaging, ads, software, storage). Check net profit and margin monthly — and reorder anything flagged LOW STOCK on sheet 2.
HOW THE NUMBERS WORK:
Total cost is unit cost plus shipping cost. Margin is price minus total cost; margin percent is margin divided by price. Fees are revenue times your platform rate (15 percent Amazon, 8 percent Etsy, 2.9 percent Shopify in the example). Net revenue is revenue minus fees. COGS is units sold times total cost. Net profit is revenue minus COGS minus fees minus other expenses. A product can be profitable before fees and unprofitable after them — check the Sales sheet profit column, not just the Products sheet.
WHO IT'S FOR:
Amazon, Etsy, and Shopify sellers who want product margins, stock levels, platform fees, and a monthly P and L in one workbook — without accounting software.
PLEASE NOTE:
- This is a digital download. No physical item will be shipped.
- Works in Microsoft Excel and Google Sheets (upload to Google Drive to open in Sheets).
- Example data for Jan-Oct 2026 is included (12 products, 30 sales rows, 1,247 units sold). Replace it with your own numbers.
- The example fee rates (Amazon 15 percent, Etsy 8 percent, Shopify 2.9 percent) are typical rates, not your rates — check your own fee schedule and change them if they differ.
- This is a bookkeeping and planning tool only, not tax, legal, or CPA advice.
- Due to the nature of digital downloads, refunds are not available. Message me before buying if you have a question.
Built by an accountant: B.S. Accountancy, ASU W. P. Carey, with revenue-reconciliation experience at Marriott and audit work at PwC.