




OBV Explained — The Slope, Not the Number
You added On Balance Volume, saw a number in the millions, and had no idea whether that was high or low. Nobody could tell you what a good reading looks like. You switched timeframe and the number changed completely. Somewhere in there you decided it was broken, or that it was just a price line with extra steps, and you took it off.
It is not broken and it is not a price line. The number really is meaningless — and once you stop reading it, the tool starts working. This is a 75-page PDF that teaches OBV from the first thing you see on the screen through to a written strategy with an entry, a stop and an explicit rule for when the trade is wrong.
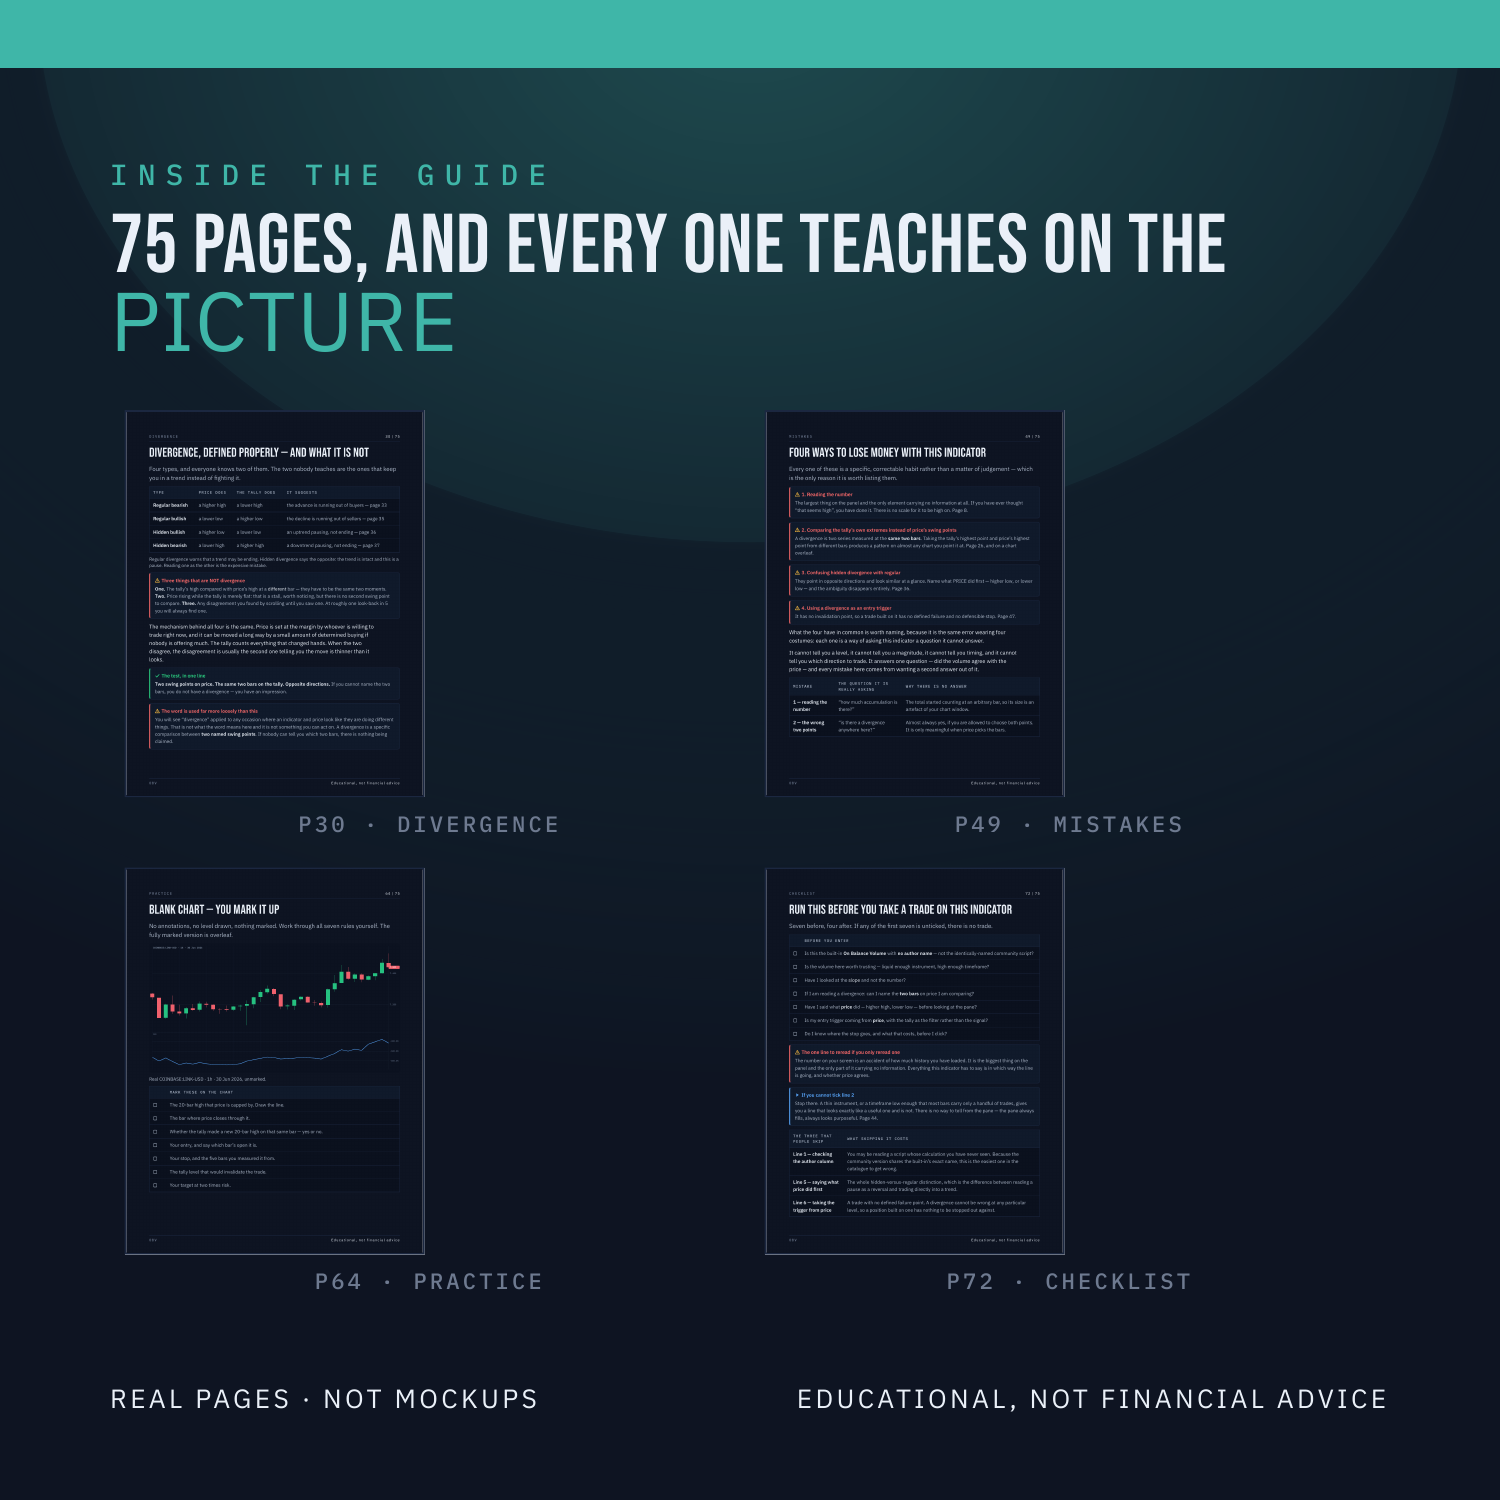
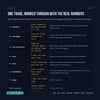
Nothing is taught underneath a chart. Every label sits on the candle, the line or the level it is describing, on real Coinbase charts across six instruments, with the measured values printed on the panel. There are three quizzes on real charts, each followed by the same chart re-shown annotated with the reasoning, plus faded practice pages where the first steps are filled in and you finish the rest.
WHAT'S INSIDE
- Why the reading on your screen means nothing — The same coin, the same moment, three timeframes, and a number that changes by 116 times and flips sign
- The tool has no settings at all — An empty Inputs tab, what that actually implies, and the one change worth making
- Slope against slope, and trendlines on the indicator — Measured across 28,210 readings: price and On Balance Volume point the same way 80% of the time, so disagreement is not rare
- All four divergences, on four different charts — Regular and hidden, bullish and bearish, each on its own real window, never the same picture relabelled
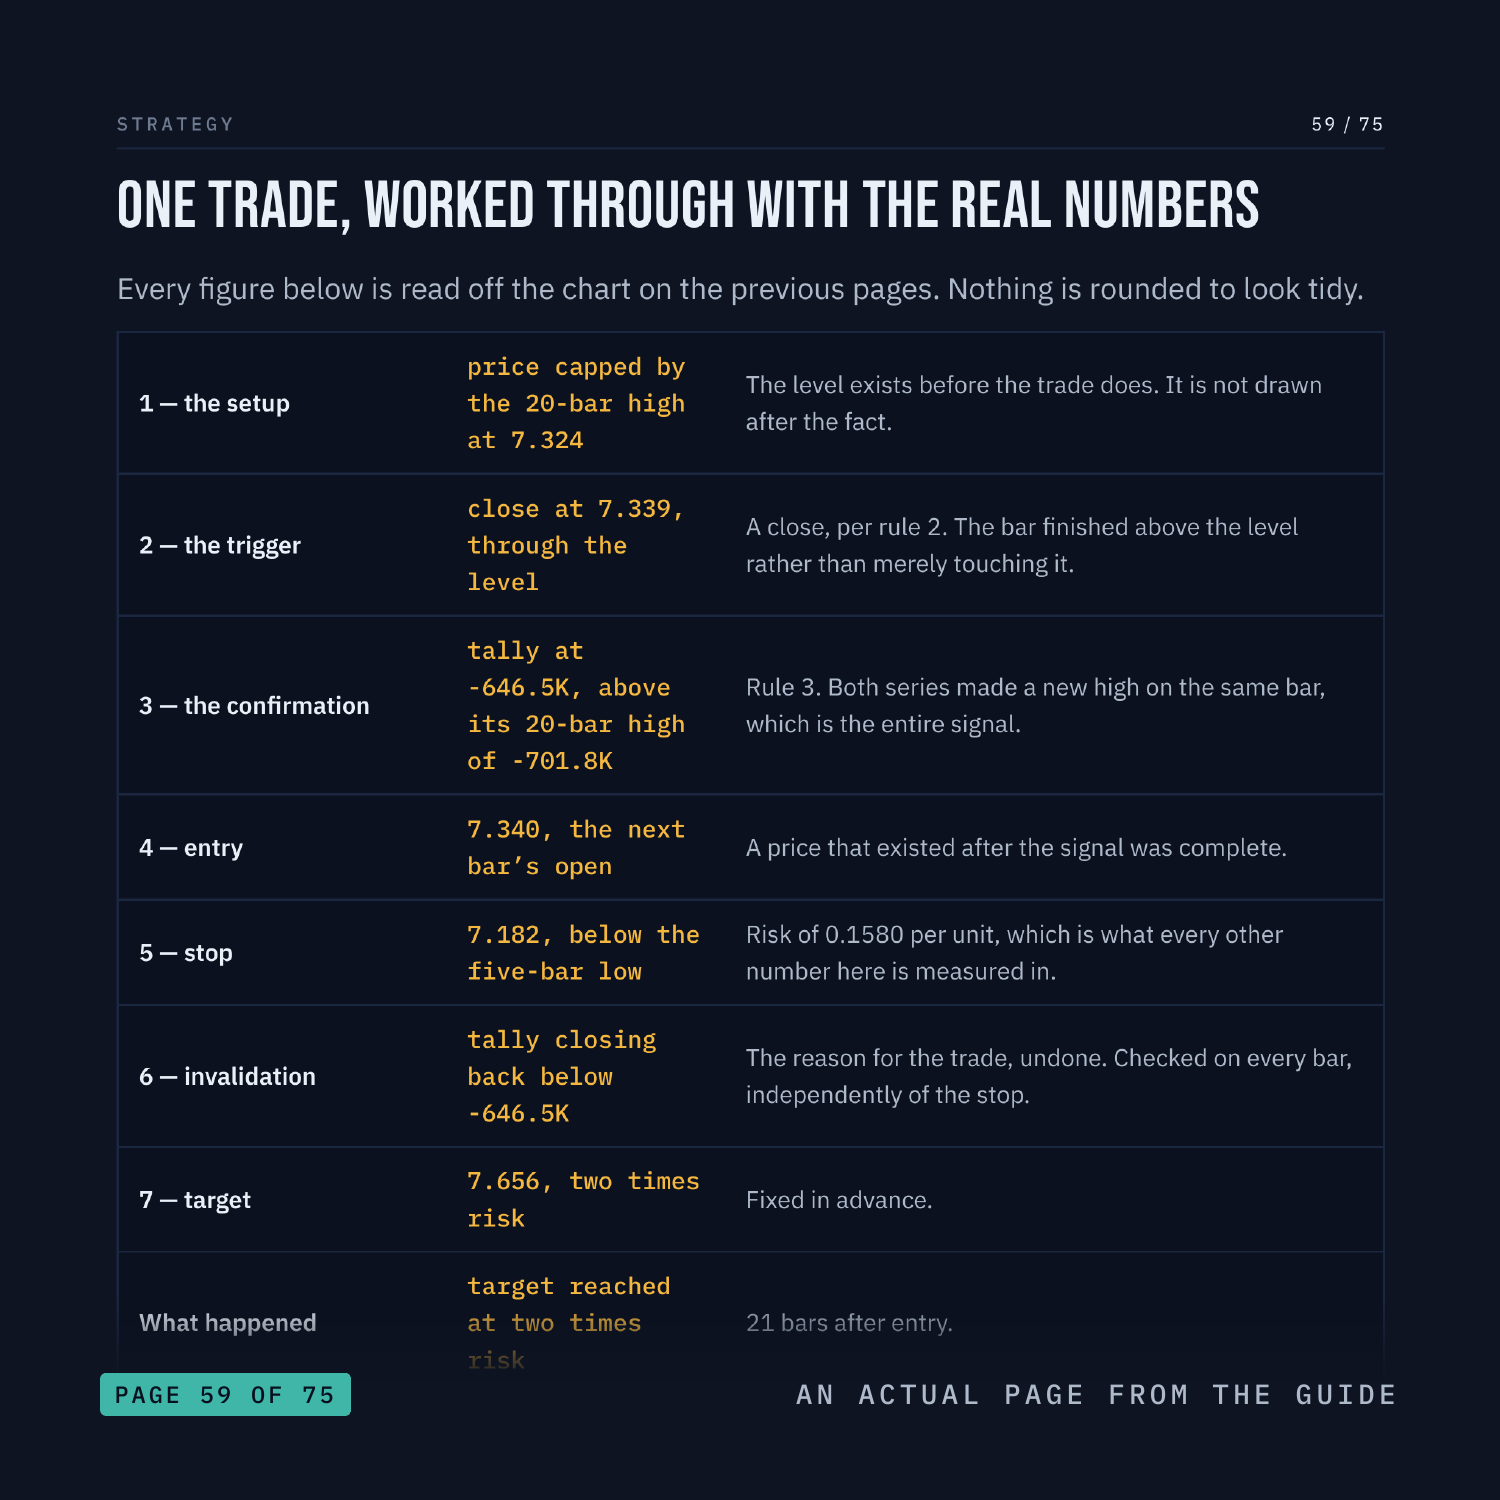
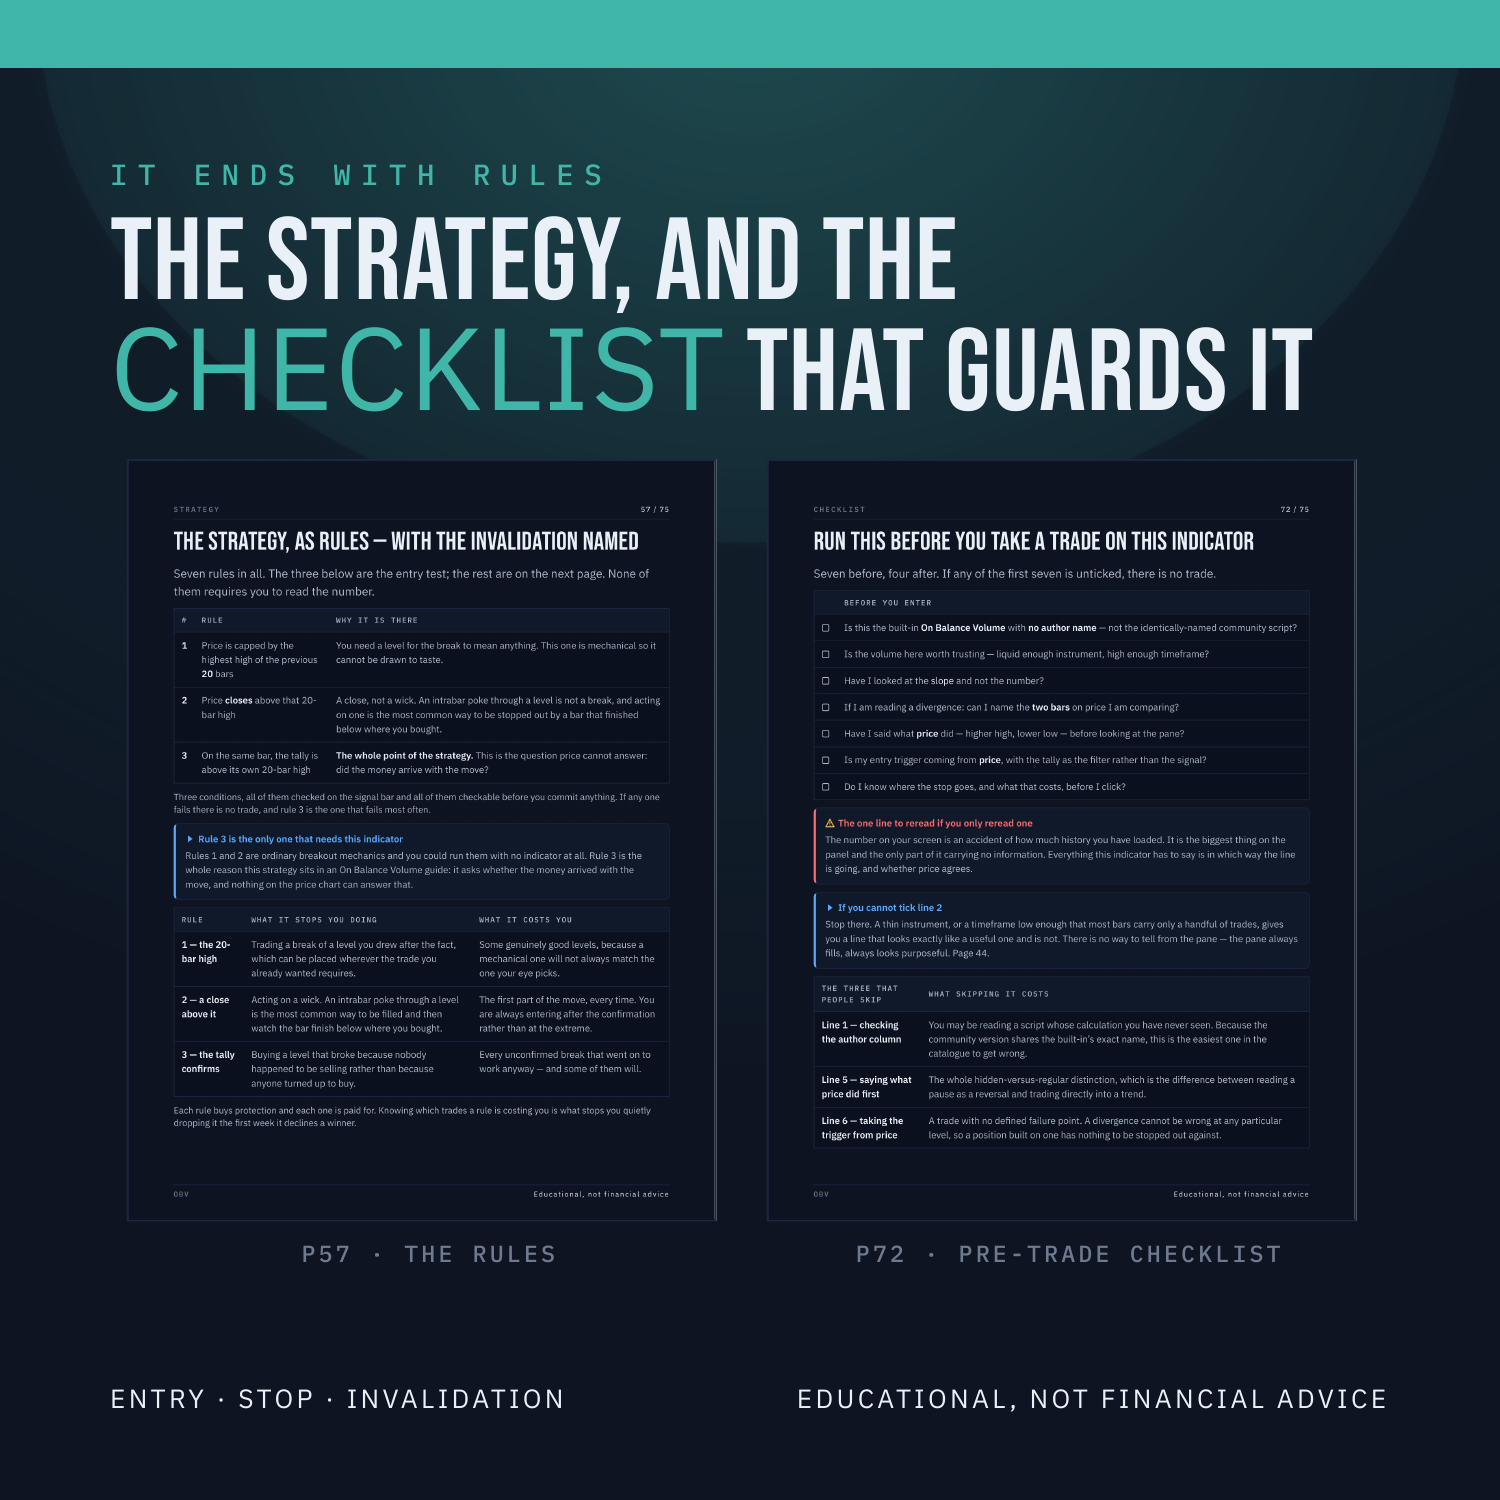
- A full strategy, with every signal reported — Entry, stop, an invalidation built from On Balance Volume itself, and what all 4 signals in the window did, winners and losers
- Three quizzes on charts, plus practice — Faded examples and a blank chart, with the reasoning on every answer
WHAT YOU'LL BE ABLE TO DO
- Ignore the reading entirely and read the slope instead
- Tell a real divergence from the two lookalikes that fool everyone
- Draw a trendline on the indicator and trade its break
- Say whether a breakout was paid for or drifted up on nothing
- Judge whether the volume you are looking at is worth trusting at all
AN HONEST NOTE
OBV is a clue, not a crystal ball. It describes what price has already done. This guide contains no win-rates, no backtest results and no promises about what you will make, because nobody can verify those and you should not trust anyone who prints them. What it hands you instead is a set of rules you can test yourself on TradingView in an afternoon. Educational, not financial advice.
Instant download. 75 pages, PDF.