


Zabbix
Zabbix – Full Description
 What is Zabbix?
Zabbix is an open-source enterprise monitoring solution used to monitor IT infrastructure such as:
Servers (Linux, Windows)
Networks (routers, switches, firewalls)
Applications
Databases
Cloud services
Virtual machines and containers
It helps teams detect problems early, analyze performance, and respond to incidents before they impact users.
 Why Zabbix Is Used
Monitor system health in real time
Detect failures automatically
Reduce downtime
Centralize monitoring in one dashboard
Alert admins before systems go down
Used by small companies to large enterprises.
 Zabbix Architecture (Core Components)
 Zabbix Server
The heart of Zabbix
Collects monitoring data
Evaluates triggers
Sends alerts
Stores data in a database
 Zabbix Agent
Installed on monitored systems.
Collects metrics (CPU, RAM, disk, processes)
Sends data to Zabbix Server
 Two types:
Passive Agent – server asks agent
Active Agent – agent sends data automatically
 Database
Stores:
Configuration data
Historical metrics
Events and alerts
Supported DBs:
MySQL / MariaDB
PostgreSQL
Oracle
 Zabbix Frontend
Web-based GUI
Dashboards
Graphs
Alerts
Configuration
Accessible via browser.
 Zabbix Proxy (Optional)
Used in distributed environments
Collects data from remote locations
Reduces load on main server
Works even if WAN link is down
 What Zabbix Can Monitor
 System Metrics
CPU usage
Memory usage
Disk space
Network traffic
Processes & services
Network Devices
Routers & switches
Firewalls
Load balancers
Using:
SNMP
ICMP (ping)
Applications
Web servers (Apache, Nginx)
Databases (MySQL, PostgreSQL)
Middleware
Cloud & Virtualization
AWS, Azure
VMware
Containers (Docker, Kubernetes – via integrations)
 Monitoring Methods
Zabbix Agent
SNMP
IPMI
JMX
HTTP checks
SSH / Telnet
External scripts
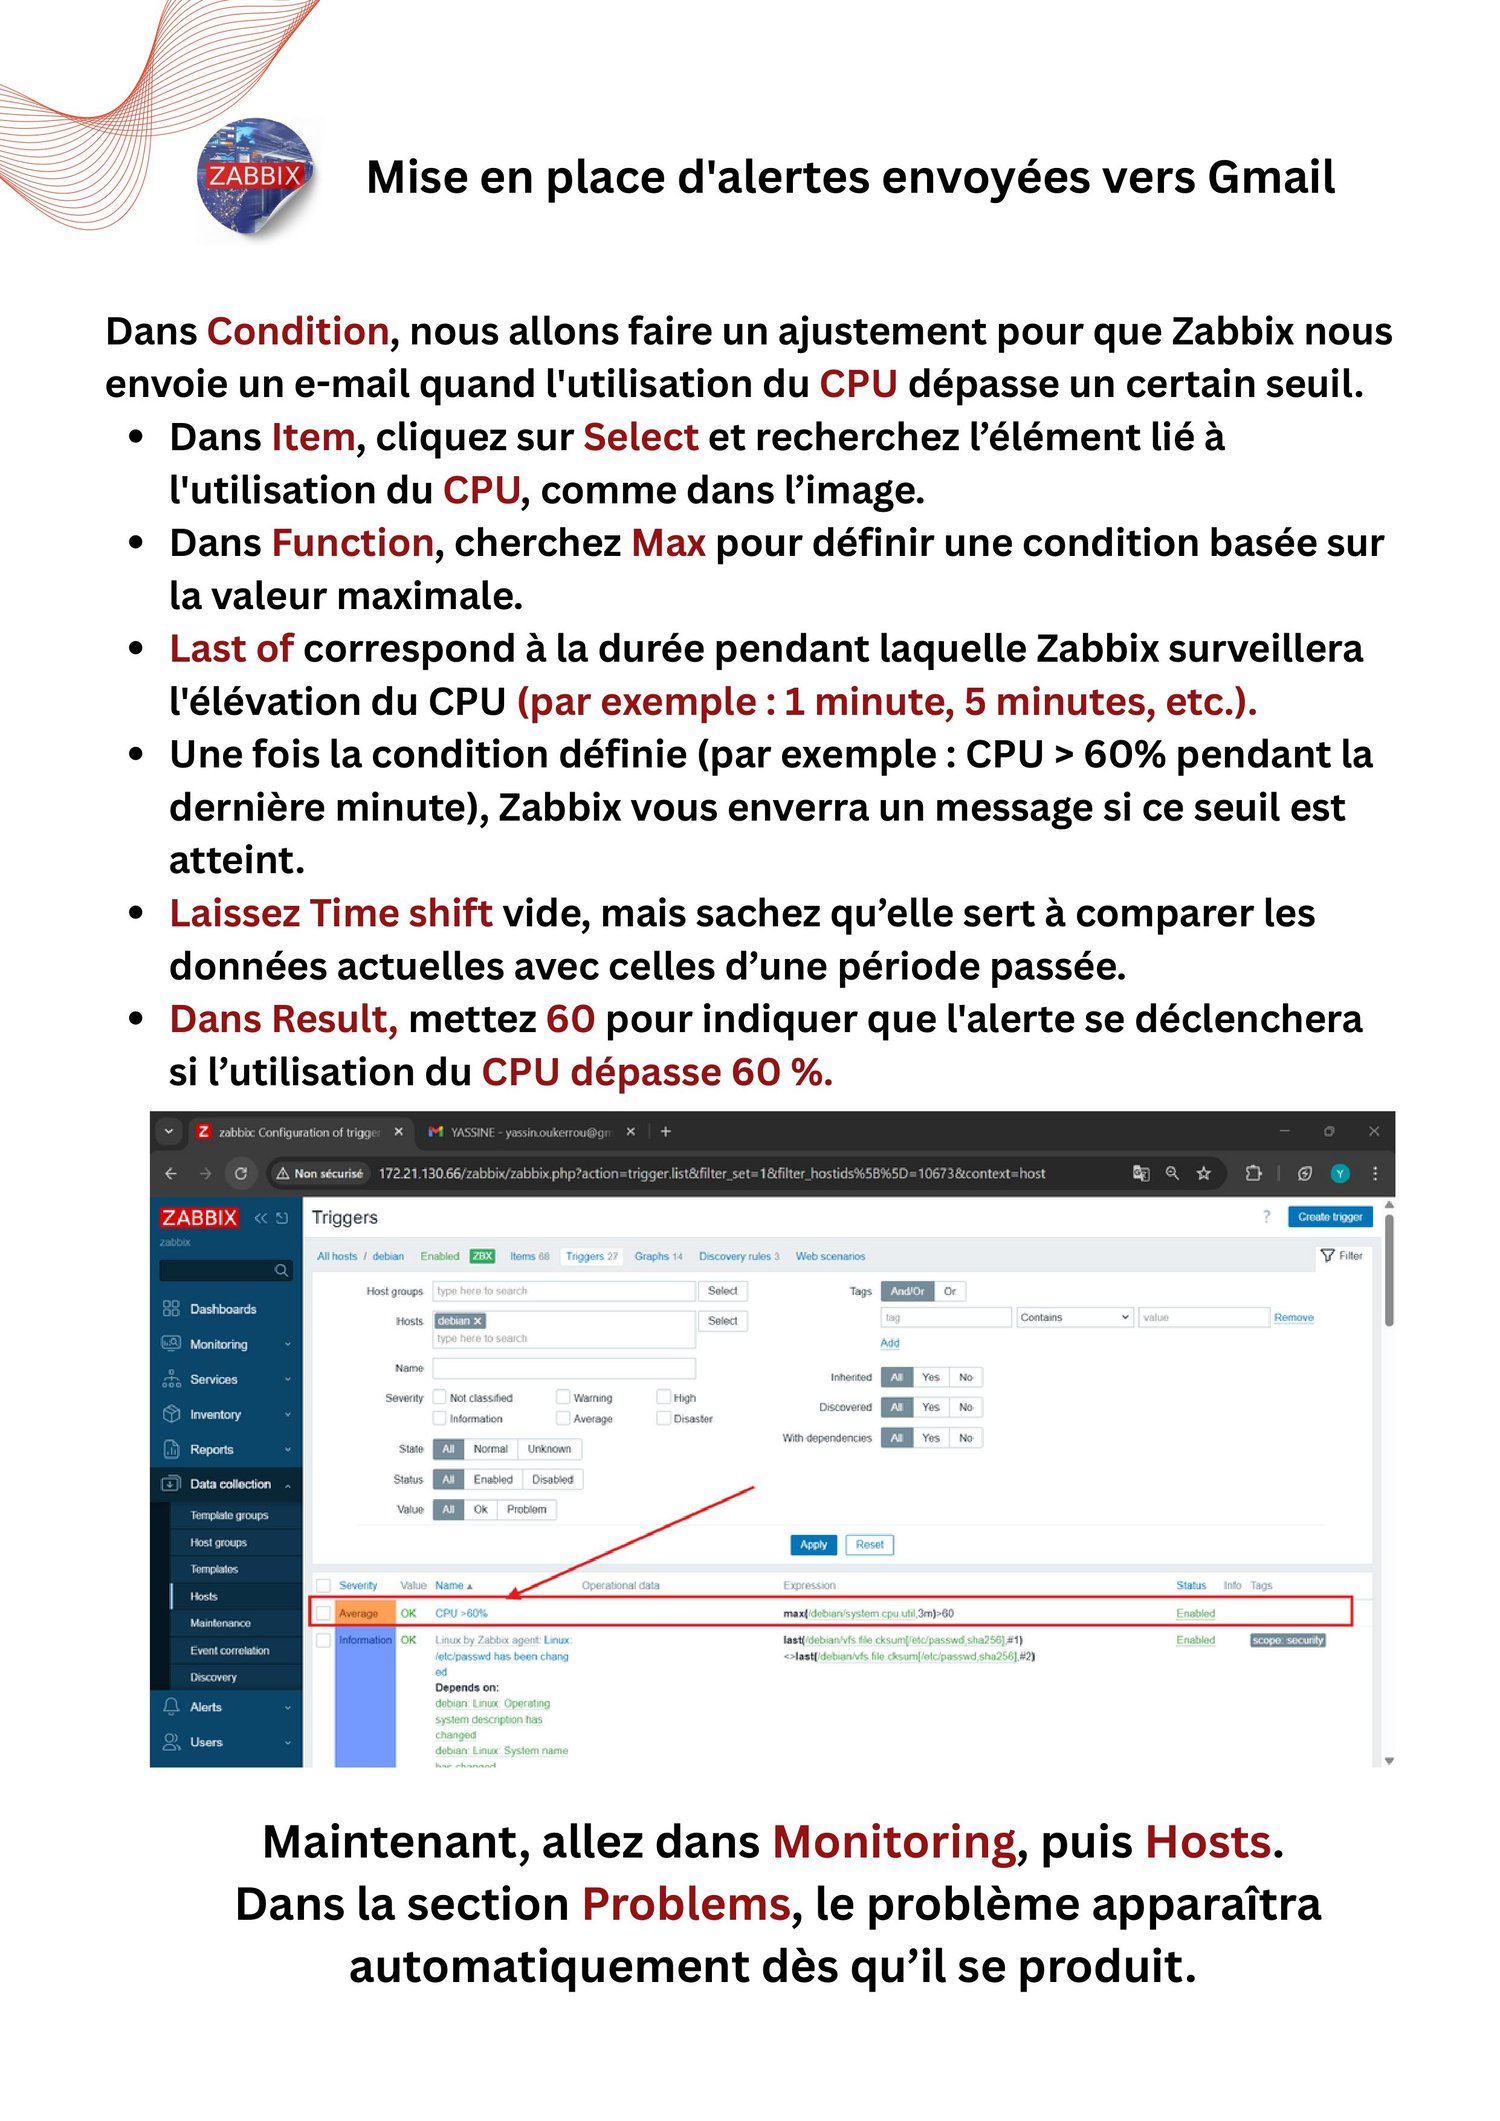
 Triggers & Alerts
 Triggers
Define problem conditions, for example:
CPU > 90% for 5 minutes
Disk space < 10%
Service stopped
 Alerts (Actions)
When trigger fires:
Send Email
Send SMS
Slack / Telegram
Run scripts
Auto-remediation actions
 Dashboards & Visualization
Real-time graphs
Custom dashboards
Maps & topology views
SLA reports
Trend analysis
 Security Features
User roles & permissions
HTTPS encryption
LDAP / Active Directory integration
Secure agent communication (TLS)
#Zabbix #Monitoring #InfrastructureMonitoring #ServerMonitoring #NetworkMonitoring #Observability