


Clinic KPI Dashboard Annual
On Sale
€34.00
€34.00
See your entire year's performance on a single screen — and never miss a trend before it becomes a problem.
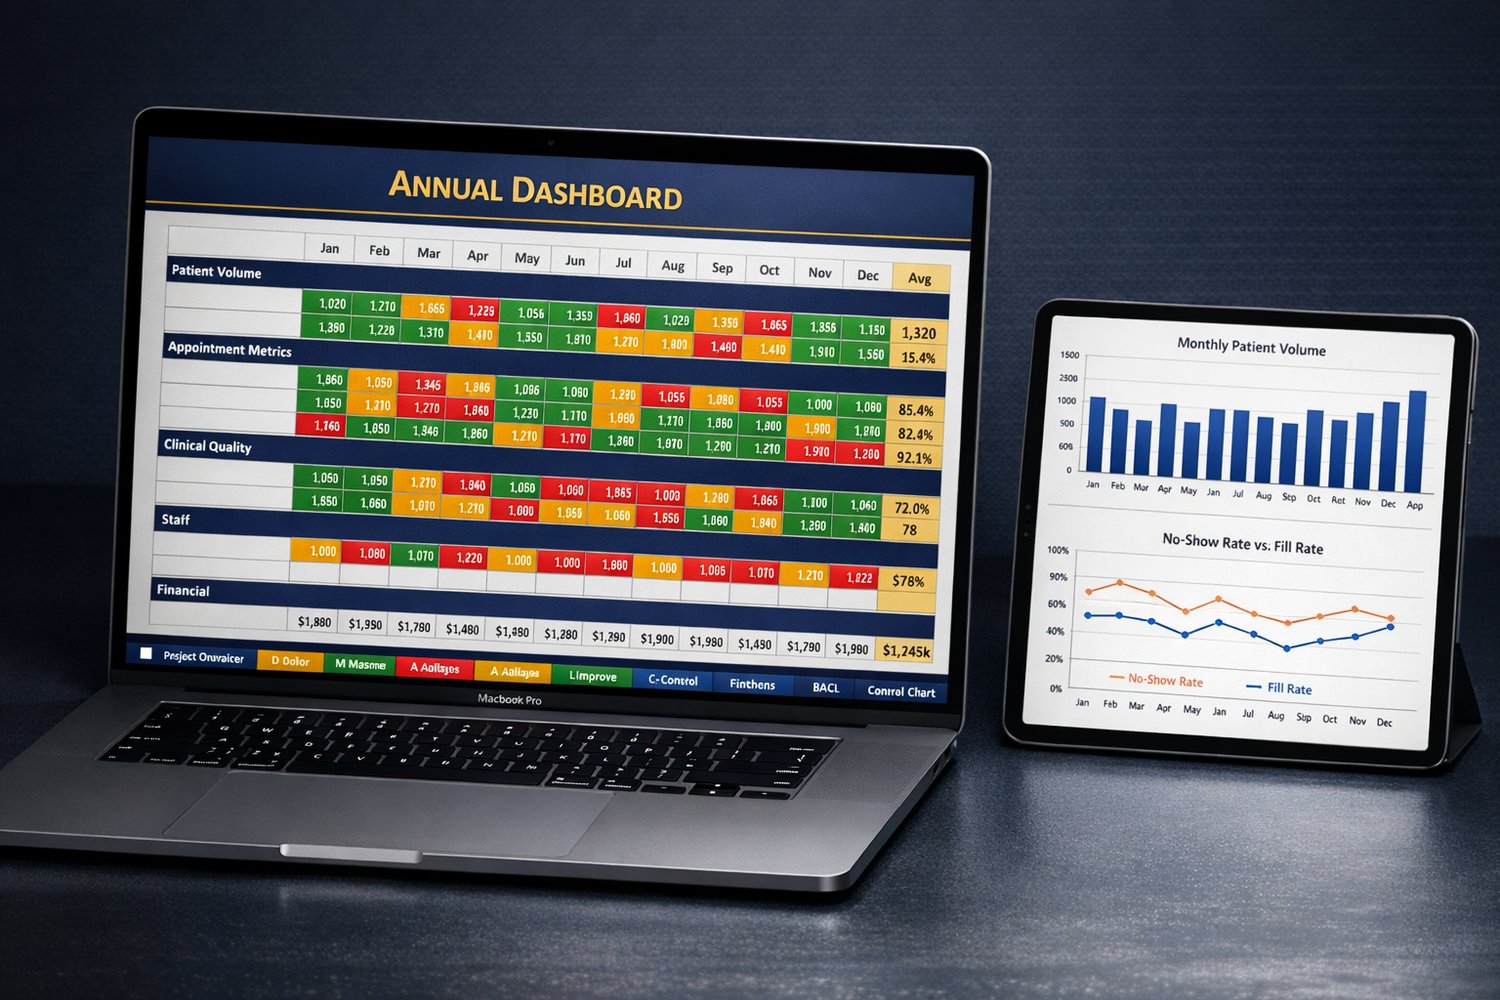
This annual dashboard tracks 19 KPIs across 5 categories every month, calculates annual averages automatically, and shows trend charts that update as you enter data.
What's inside — 4 fully connected tabs:
- 📊 Annual Dashboard — 19 KPIs × 12 months, colour-coded automatically. Annual averages in gold column
- 📅 Monthly Data Entry — One clean entry tab with target labels on every row. Enter numbers, everything else calculates
- 📈 Charts — Monthly patient volume bar chart + no-show rate vs fill rate line chart, both auto-updating
- 📋 Annual Review Template — Year-end assessment table comparing targets vs actuals with commentary column
19 KPIs tracked: Patients seen · New patients · No-show rate · Fill rate · Wait time · Patient satisfaction · Complaints · Incidents · Staff attendance · SOP compliance · Revenue · Revenue per patient · Outstanding invoices + more
✔ Works in Google Sheets and Excel
✔ 211 pre-built formulas, zero errors
✔ English version included · Spanish version available on request