







Mean Reversion Explained — Measured (PDF Guide)
Oversold means cheap and overbought means expensive, and both have been repeated at you since the first hour you looked at a chart. Neither has ever arrived with a control beside it, so you have no way to tell the claim from the habit.
This guide runs the textbook rule at its textbook thresholds on four bar sizes, adds the filter everybody recommends for it, and reports every result against the control that leg computed for itself -- including the two that came out worse than an ordinary bar. This is a 44-page PDF that teaches Mean Reversion from the first thing you see on the screen through to a written strategy with an entry, a stop and an explicit rule for when the trade is wrong.
Nothing is taught underneath a chart. Every label sits on the candle, the line or the level it is describing, on real BTC, ETH, SOL and LINK charts. There are three quizzes on real charts, each followed by the same chart re-shown annotated with the reasoning, plus faded practice pages where the first steps are filled in and you finish the rest.
WHAT'S INSIDE
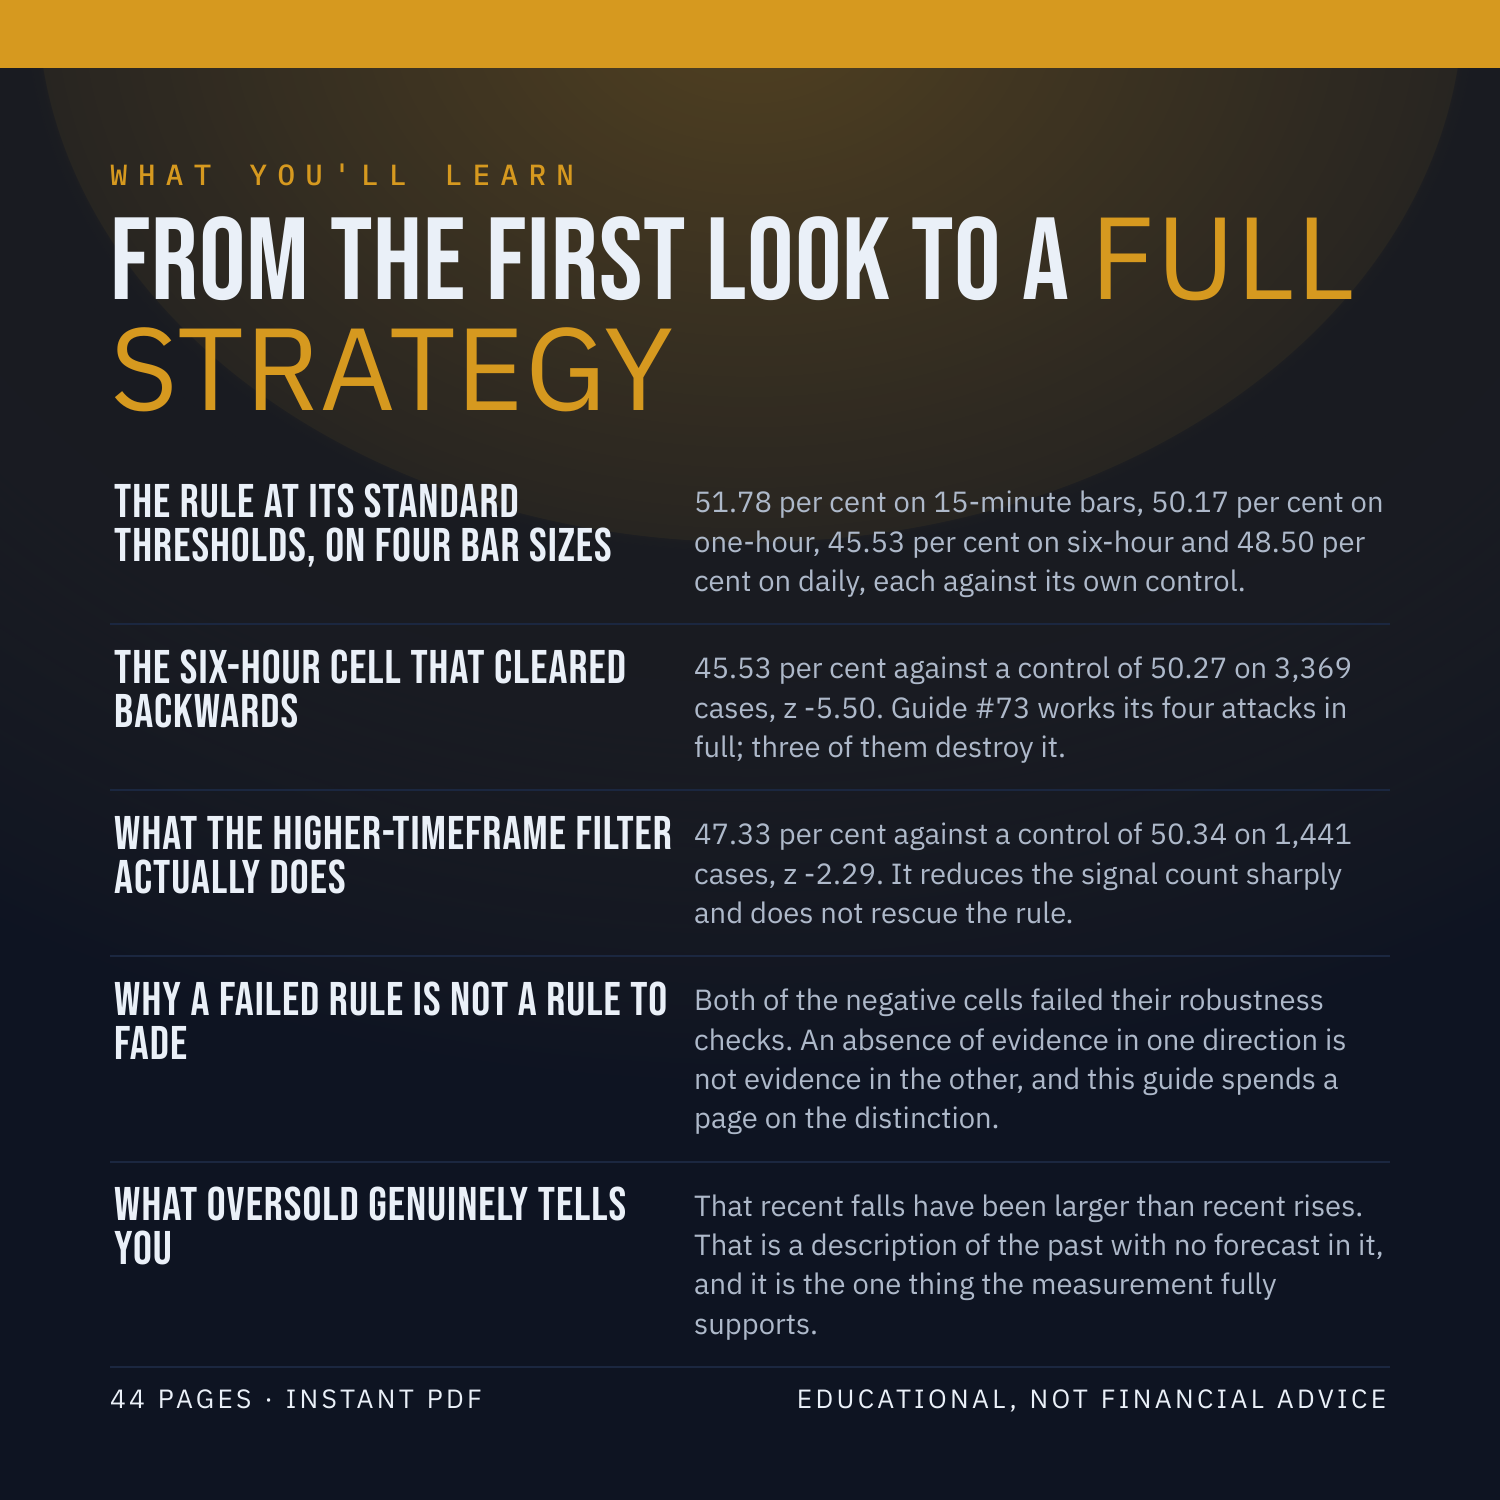
The rule at its standard thresholds, on four bar sizes -- 51.78 per cent on 15-minute bars, 50.17 per cent on one-hour, 45.53 per cent on six-hour and 48.50 per cent on daily, each against its own control.
The six-hour cell that cleared backwards -- 45.53 per cent against a control of 50.27 on 3,369 cases, z -5.50. Guide #73 works its four attacks in full; three of them destroy it.
What the higher-timeframe filter actually does -- 47.33 per cent against a control of 50.34 on 1,441 cases, z -2.29. It reduces the signal count sharply and does not rescue the rule.
Why a failed rule is not a rule to fade -- Both of the negative cells failed their robustness checks. An absence of evidence in one direction is not evidence in the other, and this guide spends a page on the distinction.
What oversold genuinely tells you -- That recent falls have been larger than recent rises. That is a description of the past with no forecast in it, and it is the one thing the measurement fully supports.
WHAT YOU'LL BE ABLE TO DO
Say what the relative strength index is actually computed from.
Tell the number from the word laid on top of it.
Explain why a failed rule is not a rule to fade.
Read a higher-timeframe filter without introducing hindsight.
Sweep a threshold and report every setting rather than the best one.
AN HONEST NOTE
Mean Reversion is a clue, not a crystal ball. It describes what price has already done. This guide contains no win-rates, no backtest results and no promises about what you will make, because nobody can verify those and you should not trust anyone who prints them. What it hands you instead is a set of rules you can test yourself on TradingView in an afternoon. Educational, not financial advice.
Instant download. 44 pages, PDF.