

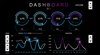
Business Intelligence Dashboard | Transform Data into Actionable Insights
On Sale
$40.00
$40.00
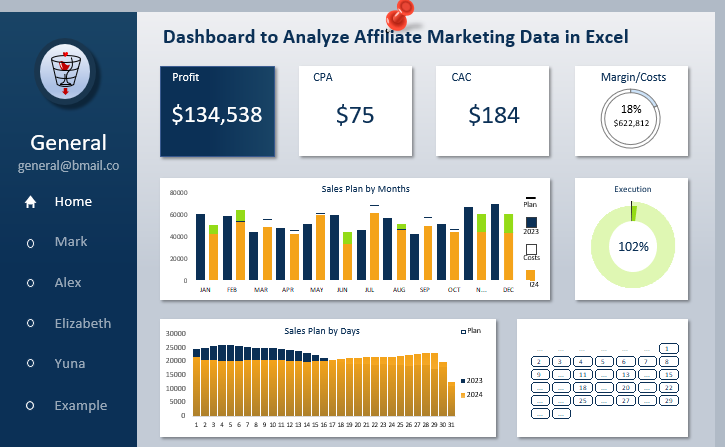
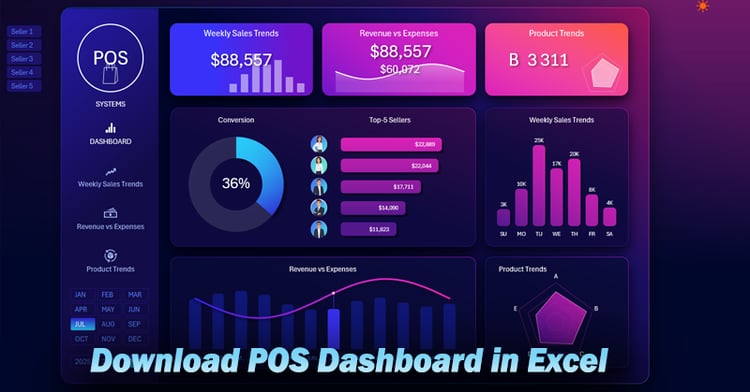
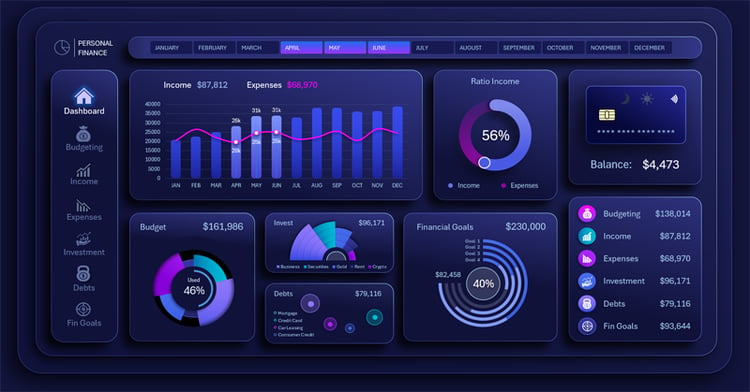
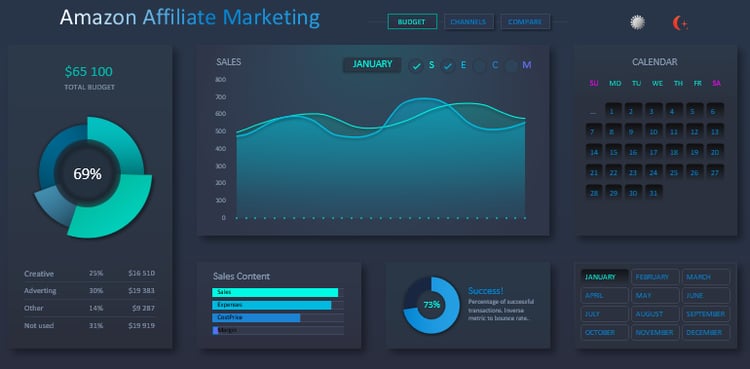
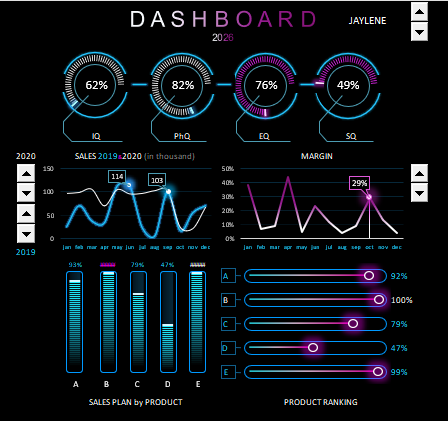
Unlock the full potential of your business data with a professional Business Intelligence (BI) Dashboard built in Excel. Transform raw data into clear, actionable insights that help executives, managers, and analysts make informed, data-driven decisions.
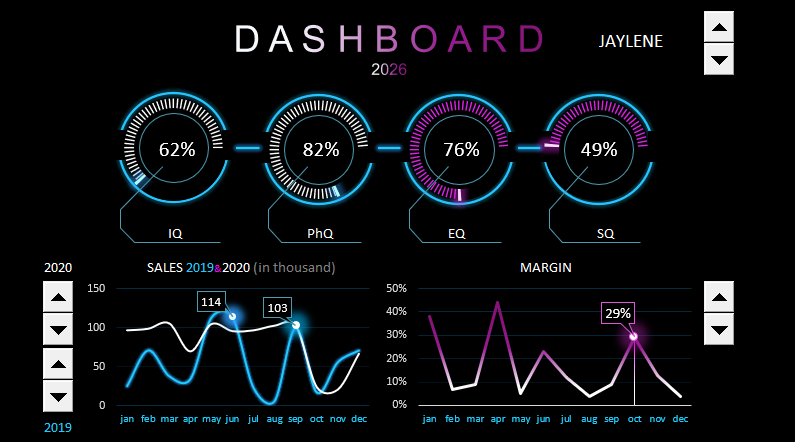
This dashboard consolidates key metrics, KPIs, and trends into one interactive, visually appealing view, making it easy to monitor performance and identify opportunities for growth.
🔍 Key Features:
- 📊 Track KPIs across departments and business units
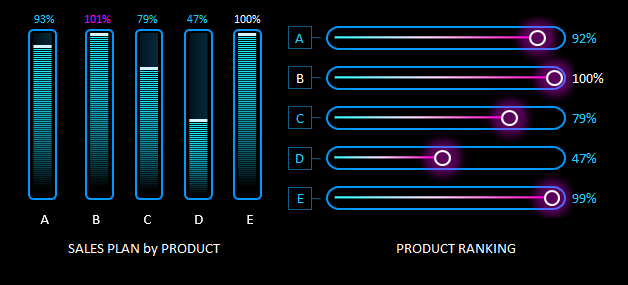
- 📈 Visualize trends, revenue, costs, and performance metrics
- 🎯 Drill-down analysis for deeper insights
- 🗂️ Filter data by time, category, region, or team
- ⚡ Excel-based, fully customizable, and easy to update
- 📑 Executive-ready visuals for presentations & reports
🎯 Ideal For:
- Business Analysts & Data Professionals
- Management & Executive Teams
- Finance & Operations Departments
- Any organization aiming to leverage data for strategic decisions
💡 Why This Dashboard?
✔ Turn complex business data into actionable insights
✔ Save hours on manual reporting
✔ Improve decision-making across departments
✔ No technical or coding skills required
📥 Instant download – Start driving smarter business decisions today!