



Comic Book Store Profit Tracker
Comic Book Store Profit Tracker Excel — products and pricing, a daily sales log, stock and inventory with low-stock flags, and a monthly P and L dashboard. Know what every product actually earns, what is actually in stock — and whether the month actually made money.
Built for comic book and hobby store owners who need to know, product by product, what a unit really earns after cost — and how much cash is sitting on the shelf — without accounting software. If dead stock and shrinkage are quietly eating the month, this workbook shows both in plain numbers.
WHAT'S INCLUDED (6 sheets):
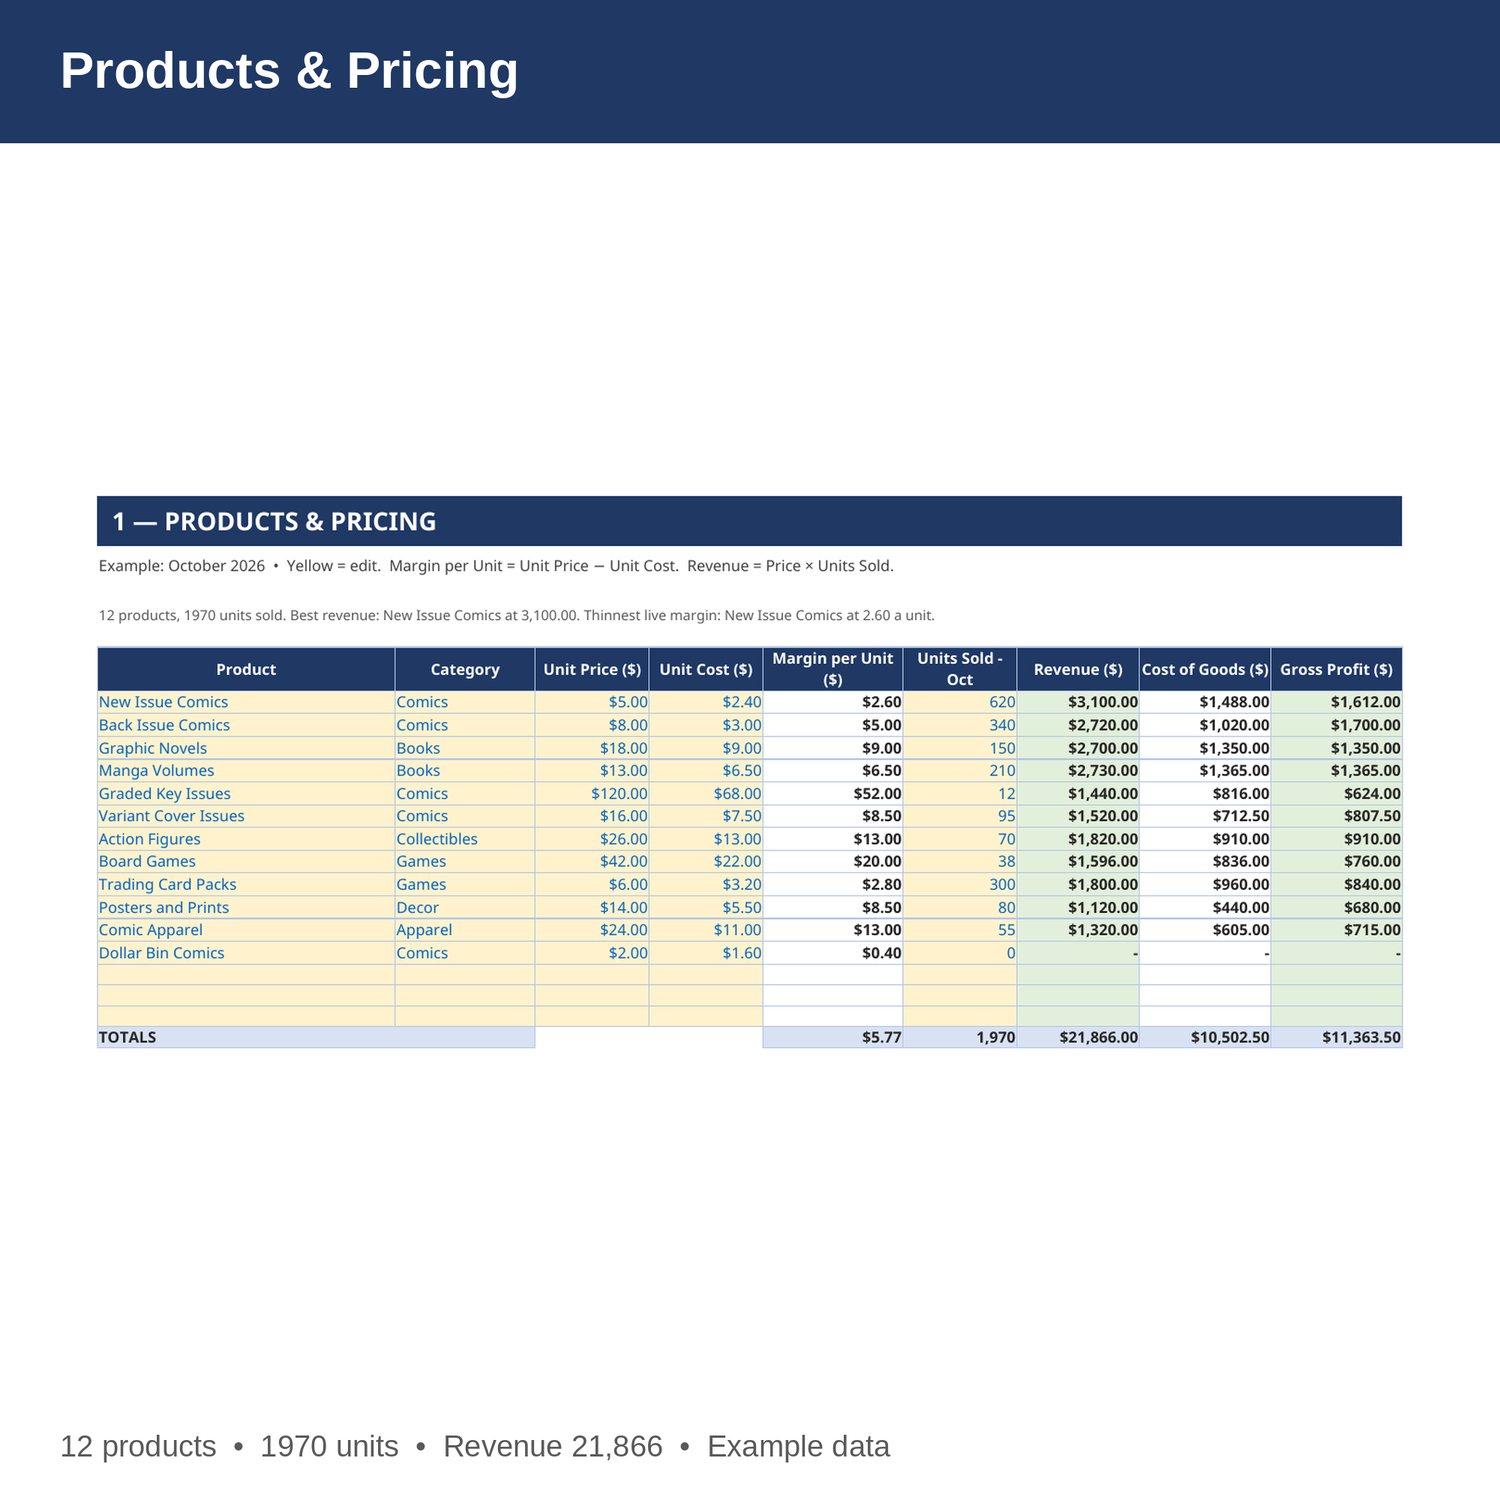
- Products and Pricing — product, category, unit price, unit cost, margin per unit, units sold, revenue, cost of goods, and gross profit for every product. Change a price and the margin and totals update.
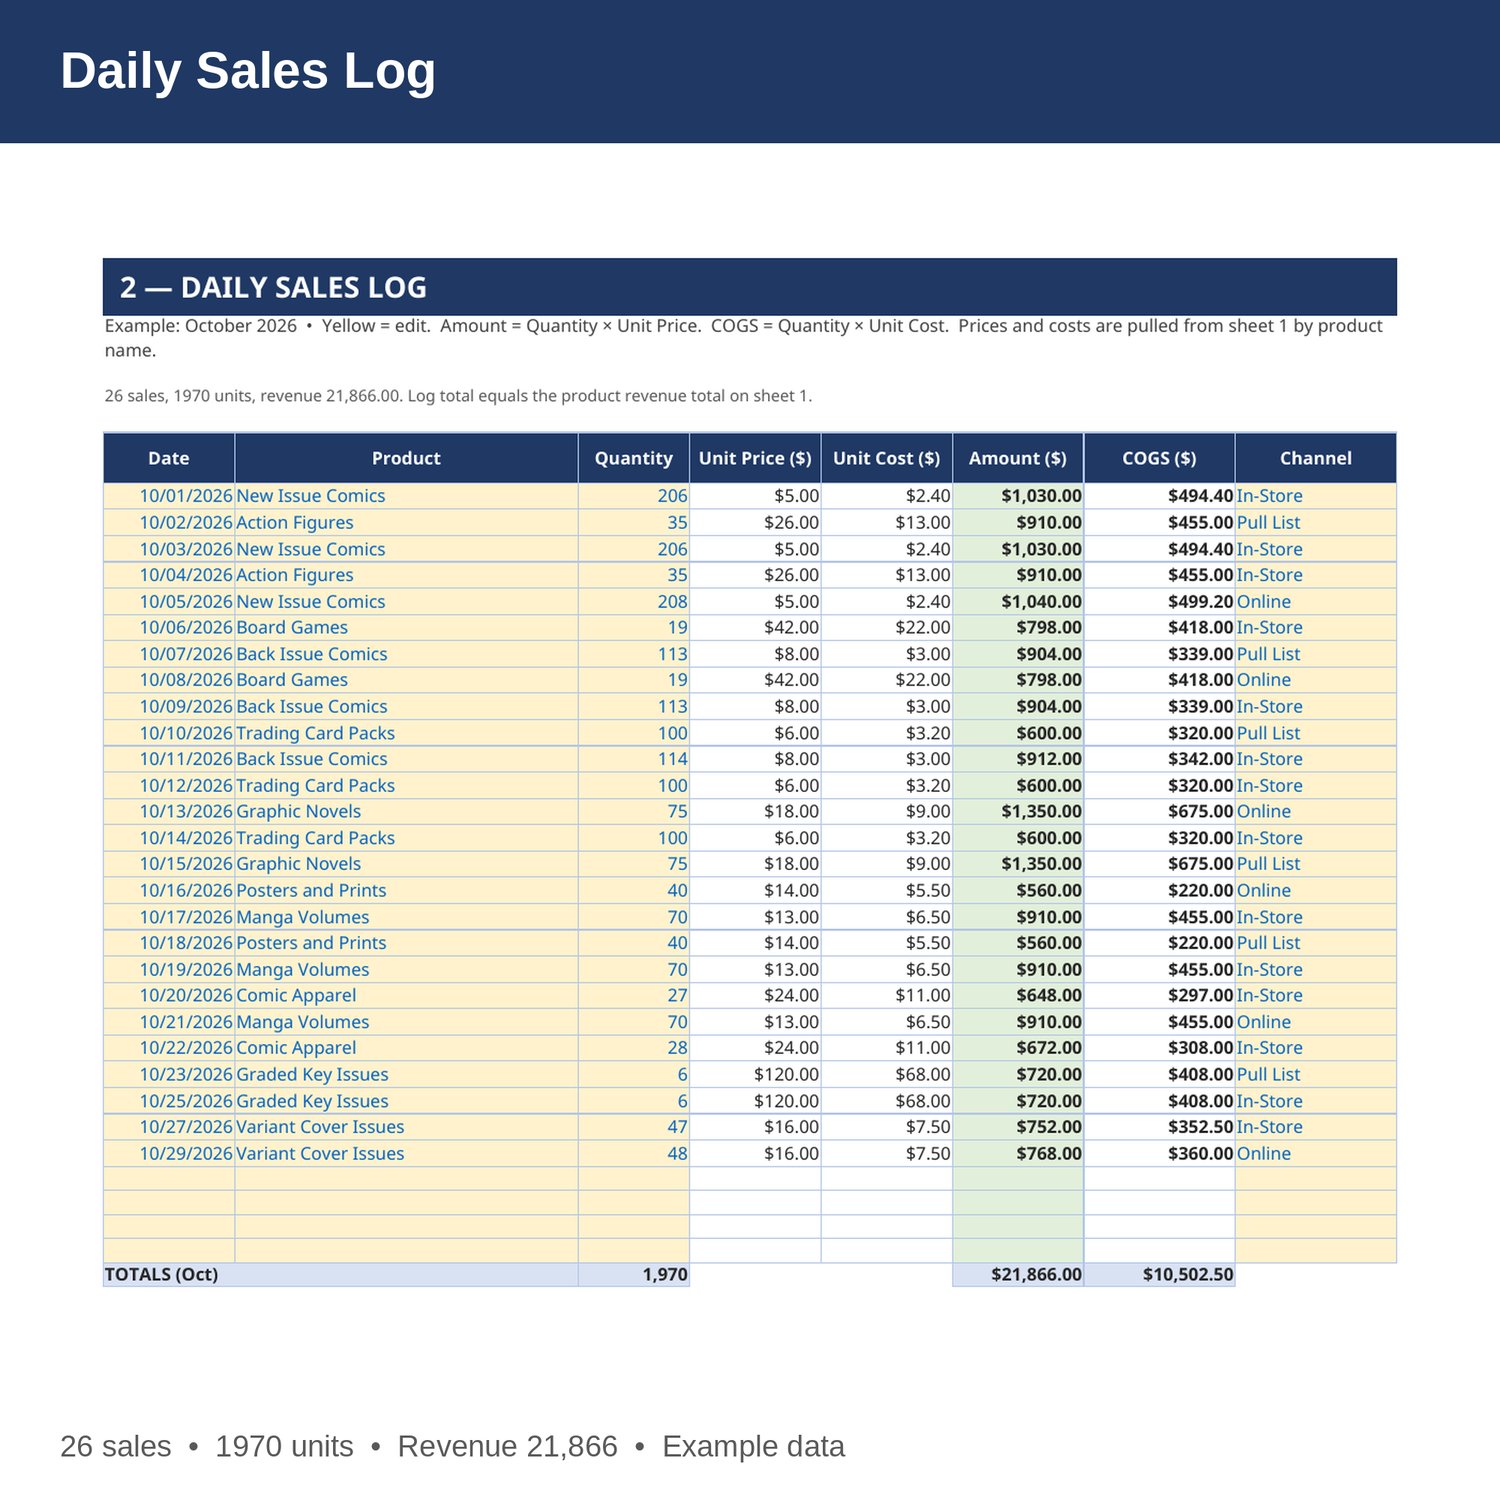
- Daily Sales Log — date, product, quantity, unit price, unit cost, amount, cost of goods, and channel for every sale. Unit price and unit cost are pulled from sheet 1 by formula.
- Stock and Inventory — opening stock, stock received, units sold, shrinkage and write-offs, closing stock, reorder point, stock value, and a status flag that reads LOW - REORDER or OUT OF STOCK by formula.
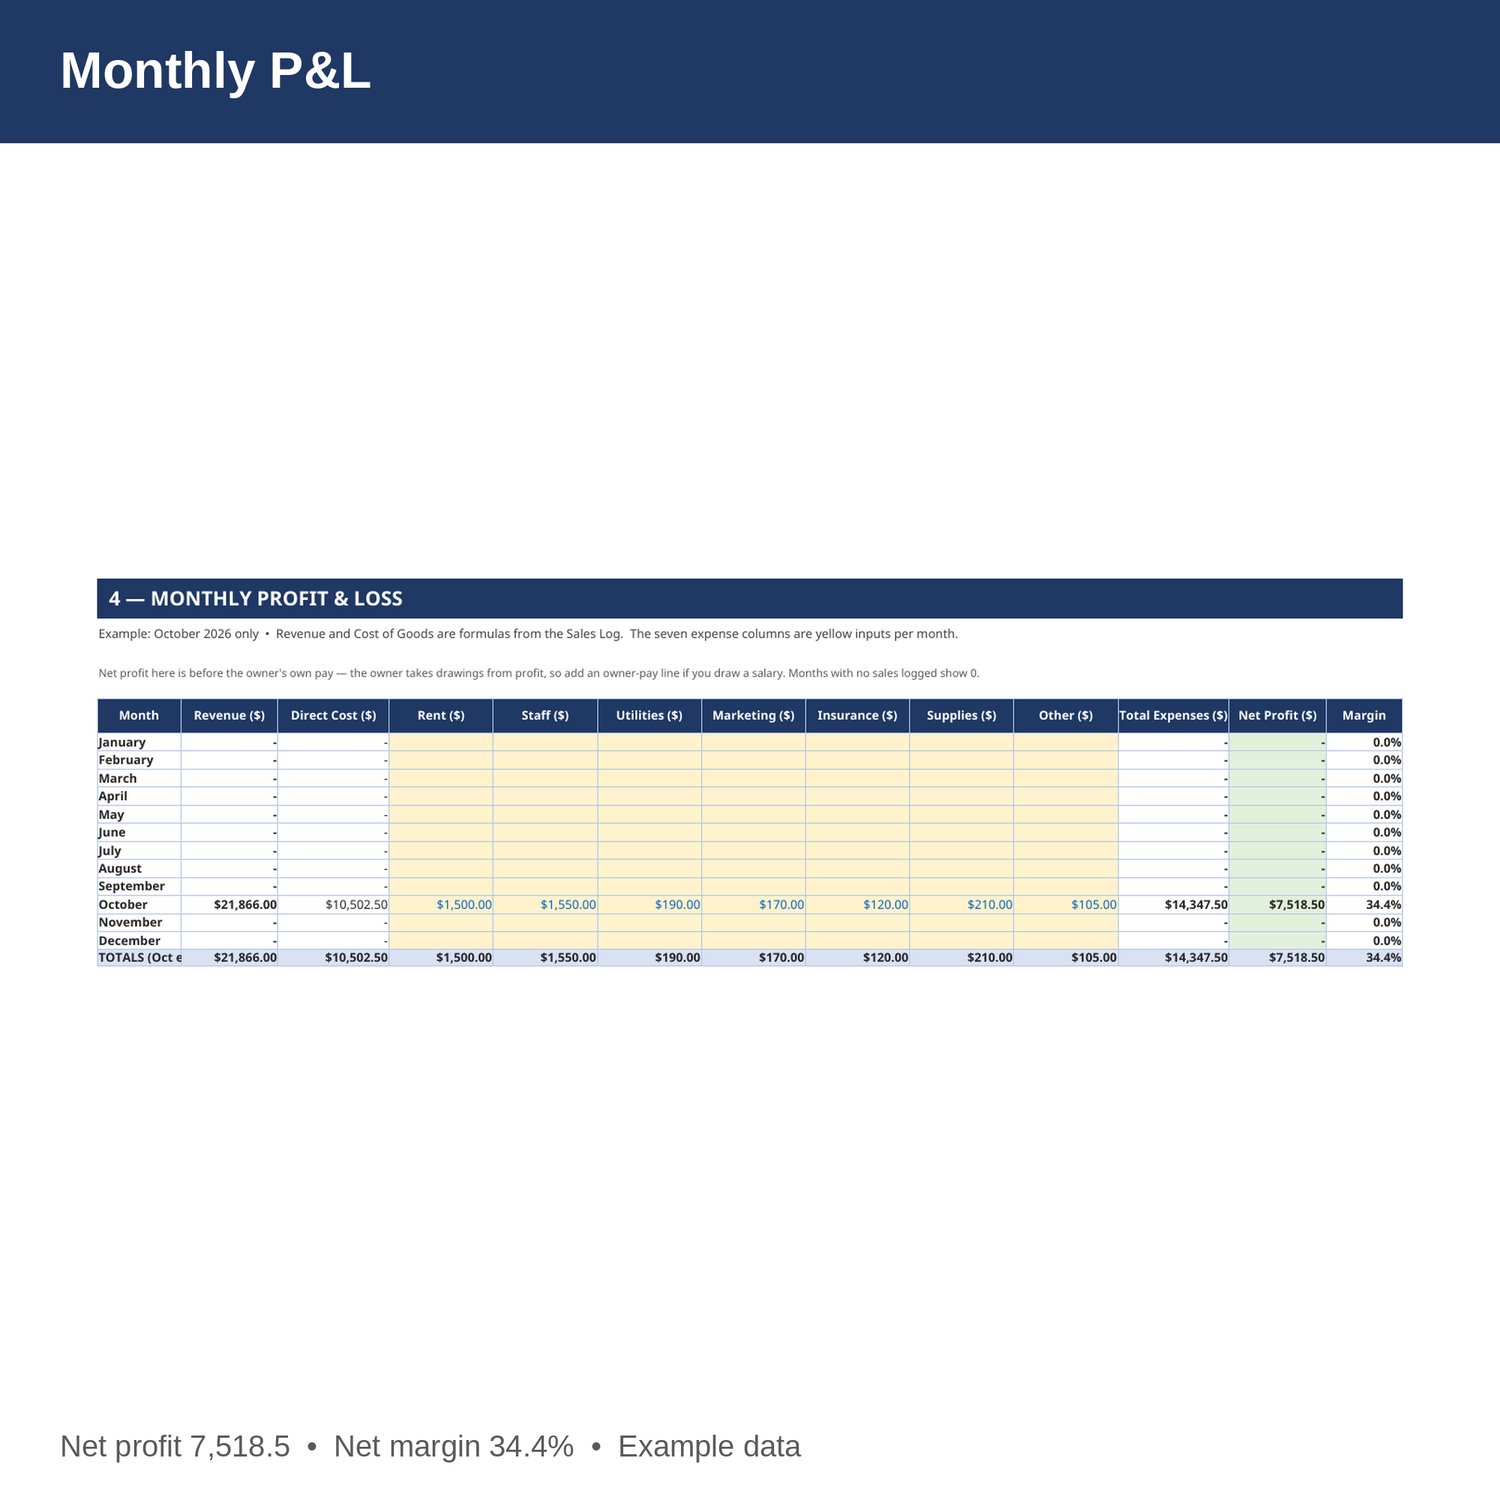
- Monthly P and L — revenue, cost of goods, rent, staff, utilities, marketing, insurance, supplies and other expenses by month, Jan-Dec, with net profit and margin. Revenue and cost of goods are formulas from the Sales Log.
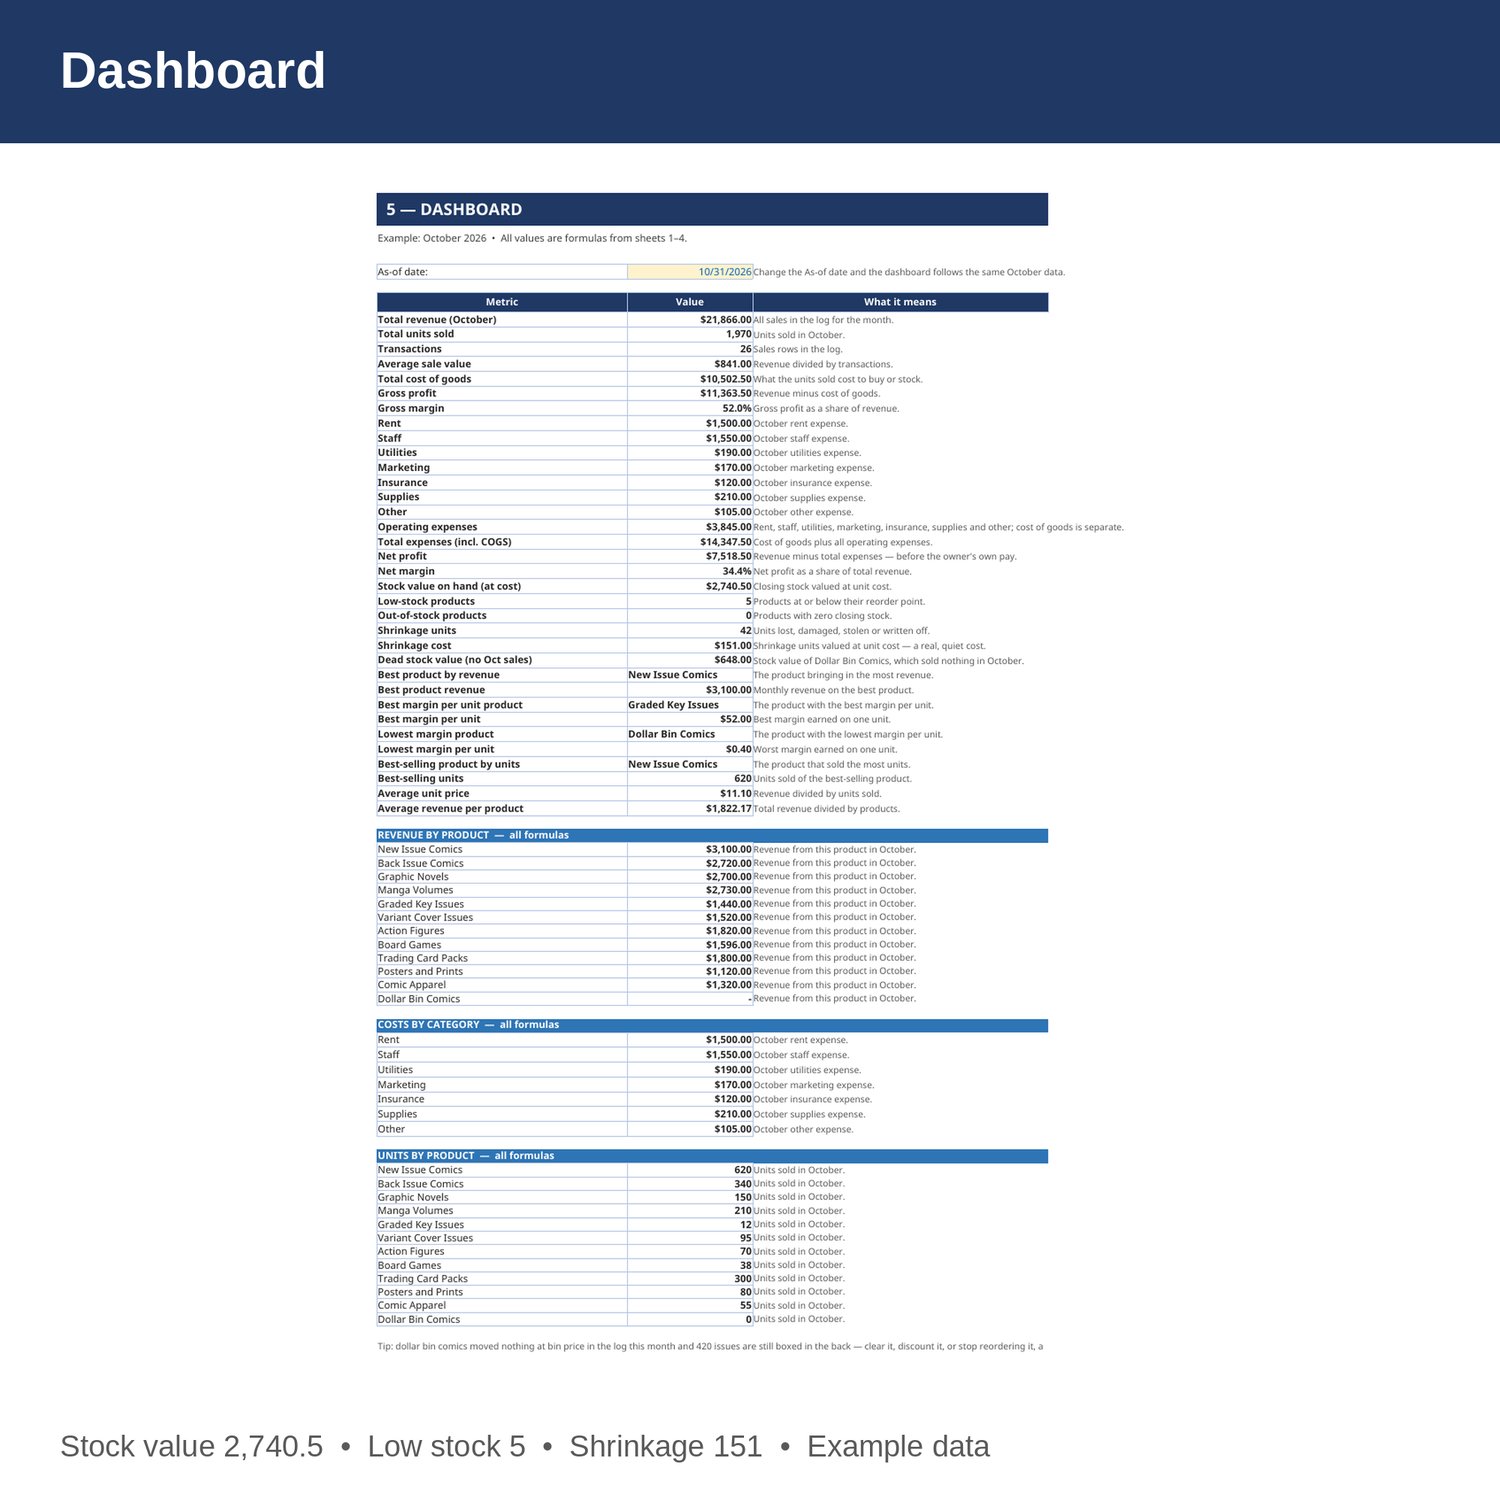
- Dashboard — total revenue, units, transactions, average sale, cost of goods, gross profit and margin, expenses, net profit and margin, stock value, low-stock and out-of-stock counts, shrinkage cost, dead stock value, best and weakest products, revenue by product, costs by category, and units by product.
- Cover and How to Use — start here. Yellow cells are the only ones you edit.
EXAMPLE DATA (October 2026 — replace with your own numbers):
- 12 products; 1970 units sold in 26 logged sales; total revenue 21,866; cost of goods 10,502.5; gross profit 11,363.5; gross margin 52.0 percent
- Operating expenses 3,845 (rent 1,500, staff 1,550, utilities 190, marketing 170, insurance 120, supplies 210, other 105); total expenses 14,347.5; net profit 7,518.5; net margin 34.4 percent
- Stock: opening 1,546, received 1,280, shrinkage 42 units costing 151, closing 814 units worth 2,740.5 at cost; 5 low-stock flags, 0 out of stock
- Best product by revenue: New Issue Comics, 3,100. Best margin per unit: Graded Key Issues, 52. Best seller by units: New Issue Comics, 620 units
- Dead stock: Dollar Bin Comics sold nothing in October and holds 648 of stock value. Average sale 841; average revenue per product 1,822.17
- Honest tension in the example: Dollar bin comics moved nothing at bin price in the log this month and 420 issues are still boxed in the back, and dollar bin comics earn only 0.40 an issue, the thinnest margin in the store, before bags and boards. Bagging damage and shrinkage took 42 units in october.
HOW IT WORKS:
1. Download the Excel file instantly after purchase.
2. On sheet 1, enter each product, category, unit price, unit cost, and units sold. Margin per unit, revenue, cost of goods, and gross profit fill in by formula.
3. On sheet 2, add a row per sale: date, product (spelled exactly as on sheet 1), quantity, and channel. Price, cost, amount and cost of goods fill in by formula.
4. On sheet 3, enter opening stock, stock received, shrinkage and the reorder point for each product. Closing stock, stock value and the low-stock flag fill in by formula.
5. On sheet 4, enter rent, staff, utilities, marketing, insurance, supplies and other expenses each month, then check gross margin, stock value and net profit on the Dashboard.
HOW THE NUMBERS WORK:
Margin per unit is unit price minus unit cost. Revenue is price times units sold. Closing stock is opening stock plus stock received, minus units sold, minus shrinkage. Stock value is closing stock times unit cost. Net profit is revenue minus cost of goods and rent, staff, utilities, marketing, insurance, supplies and other expenses — before the owner's own pay, which comes out of profit as drawings.
PLEASE NOTE:
- Instant digital download. No physical item ships.
- Works in Microsoft Excel and Google Sheets (upload to Google Drive to open in Sheets).
- Example data is included so you can see how it works. Replace the yellow cells with your own numbers — yellow cells are the only ones you edit.
- This is a bookkeeping tool, not tax, legal, or CPA advice.
- Built by an accountant: B.S. Accountancy, ASU W. P. Carey, with revenue-reconciliation experience at Marriott and audit work at PwC.