

Data Modeler Comparison (2025) - 17 Tools
Purpose
Every database software comparison review has disappointed me. There was never enough detail. Too often, it seemed the author had regurgitated the vendor’s talking points, rather than actually testing them. I set out to correct that and give my clients and employers the best recommendations that meet their needs.
I have been evaluating data modeling tools for clients and employers since 1996. This is the 8th iteration of my evaluation matrix. If you do not have a modeling tool, or the one you have is not good, or you're paying too much, this evaluation should save you at least two months of painstaking work.
You may be able to use these results to justify a change of data modeling toolset. One client where I did this saved $150,000. Another saved $50,000.
I hope you find it helpful. Email info@datasherpa.blog if you have any questions or corrections, or would like to talk about data modeling.
Content
I put 17 modeling tools through a gauntlet of 70 criteria (totaling 1,190 data points). The criteria include:
- Cost and maintenance [4 criteria]
- OS Support [3 criteria]
- Cloud Support [3 criteria]
- Database Support and Fluency [10 criteria]
- Modeling and Standards [9 criteria]
- Usability [14 criteria]
- Reverse Engineering [10 criteria]
- Forward Engineering [3 criteria]
- Diagramming [7 criteria]
- Concurrent Team Modeling and Version Control [3 criteria]
- Publishing and Documentation [6 criteria]
- and the holy grail: Auto-generation and synchronization of published models and diagrams
Instructions
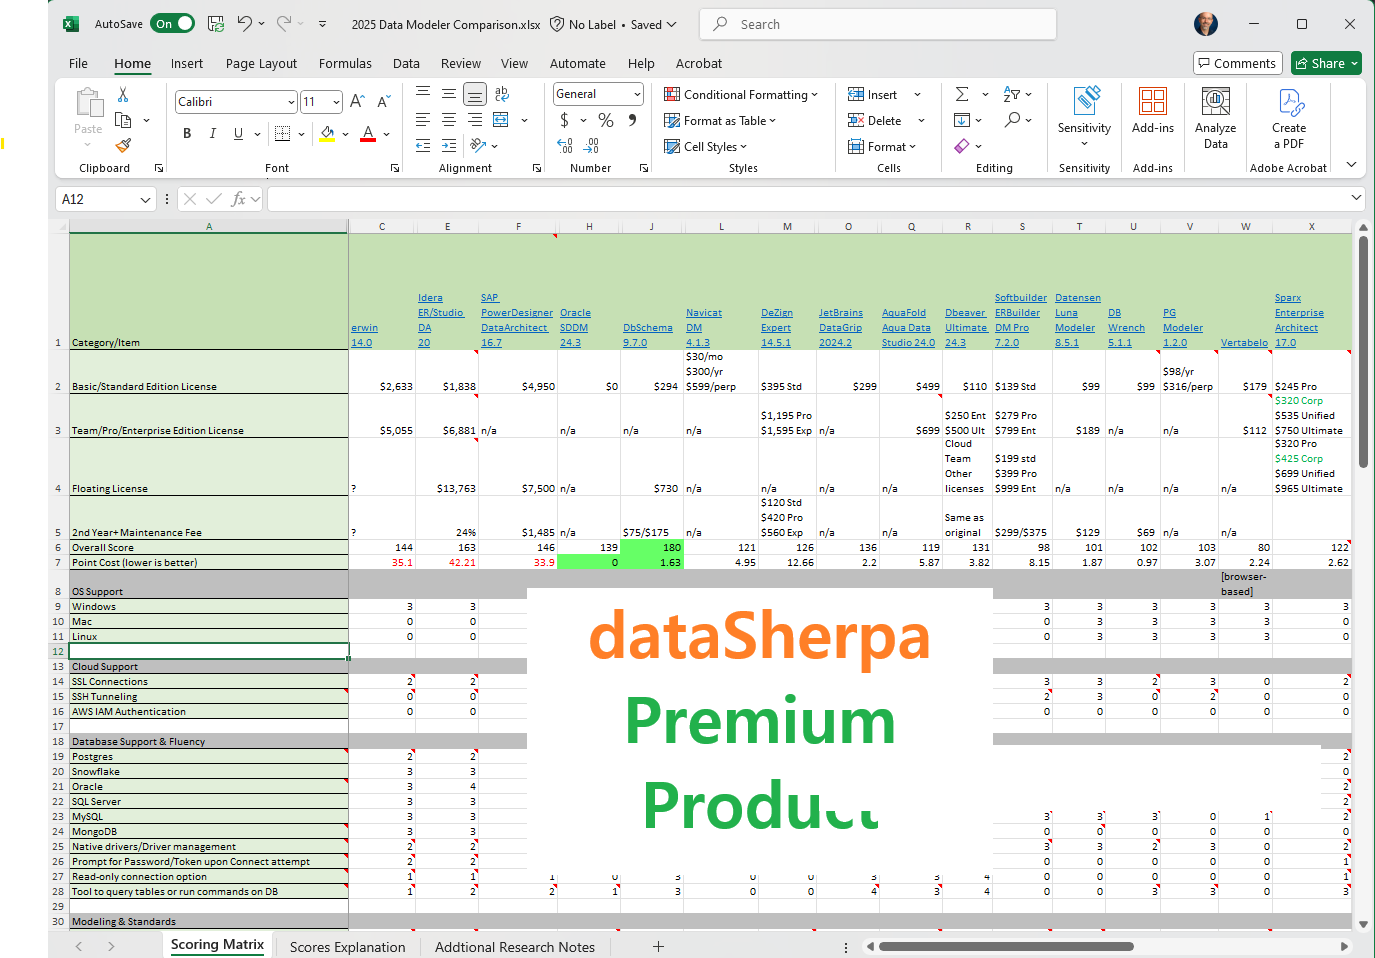
This is an Excel file. It uses Excel's ability to insert a note in every cell. The scores are from 0 to 5 and are explained in the "Scores Explanation" worksheet. The "Scoring Matrix" is the main worksheet.
Red text or highlighting indicates something that is problematic or exceptionally negative.
Green text (or a score of 4 or 5) indicates something exceptionally positive.
Row 1 holds the name of each data modeling tool. Clicking in the Row 1 cells takes you to the vendor's website.
Rows 2 - 5 hold purchase price and ongoing support/maintenance fees (as of Nov '24 to Mar '25)
Row 6 holds the tallied score
Row 7 divides the price of the license I would likely buy, by the score, giving us a cost per scored point, the lower the better if the tool is good.
Rows 8 - 97 hold the scores for each tool. Hover over the little red triangle in the cell's corner for further detail about why that score was chosen. Excel is notorious for messing up the original note's size and position. If you can't see the whole note, right-click in the cell, select Edit Note, and then expand the note's rectangle to see the whole note.
Row 99 holds some final thoughts and additional features of interest that weren't part of my requirements, but might be useful for your shop.