

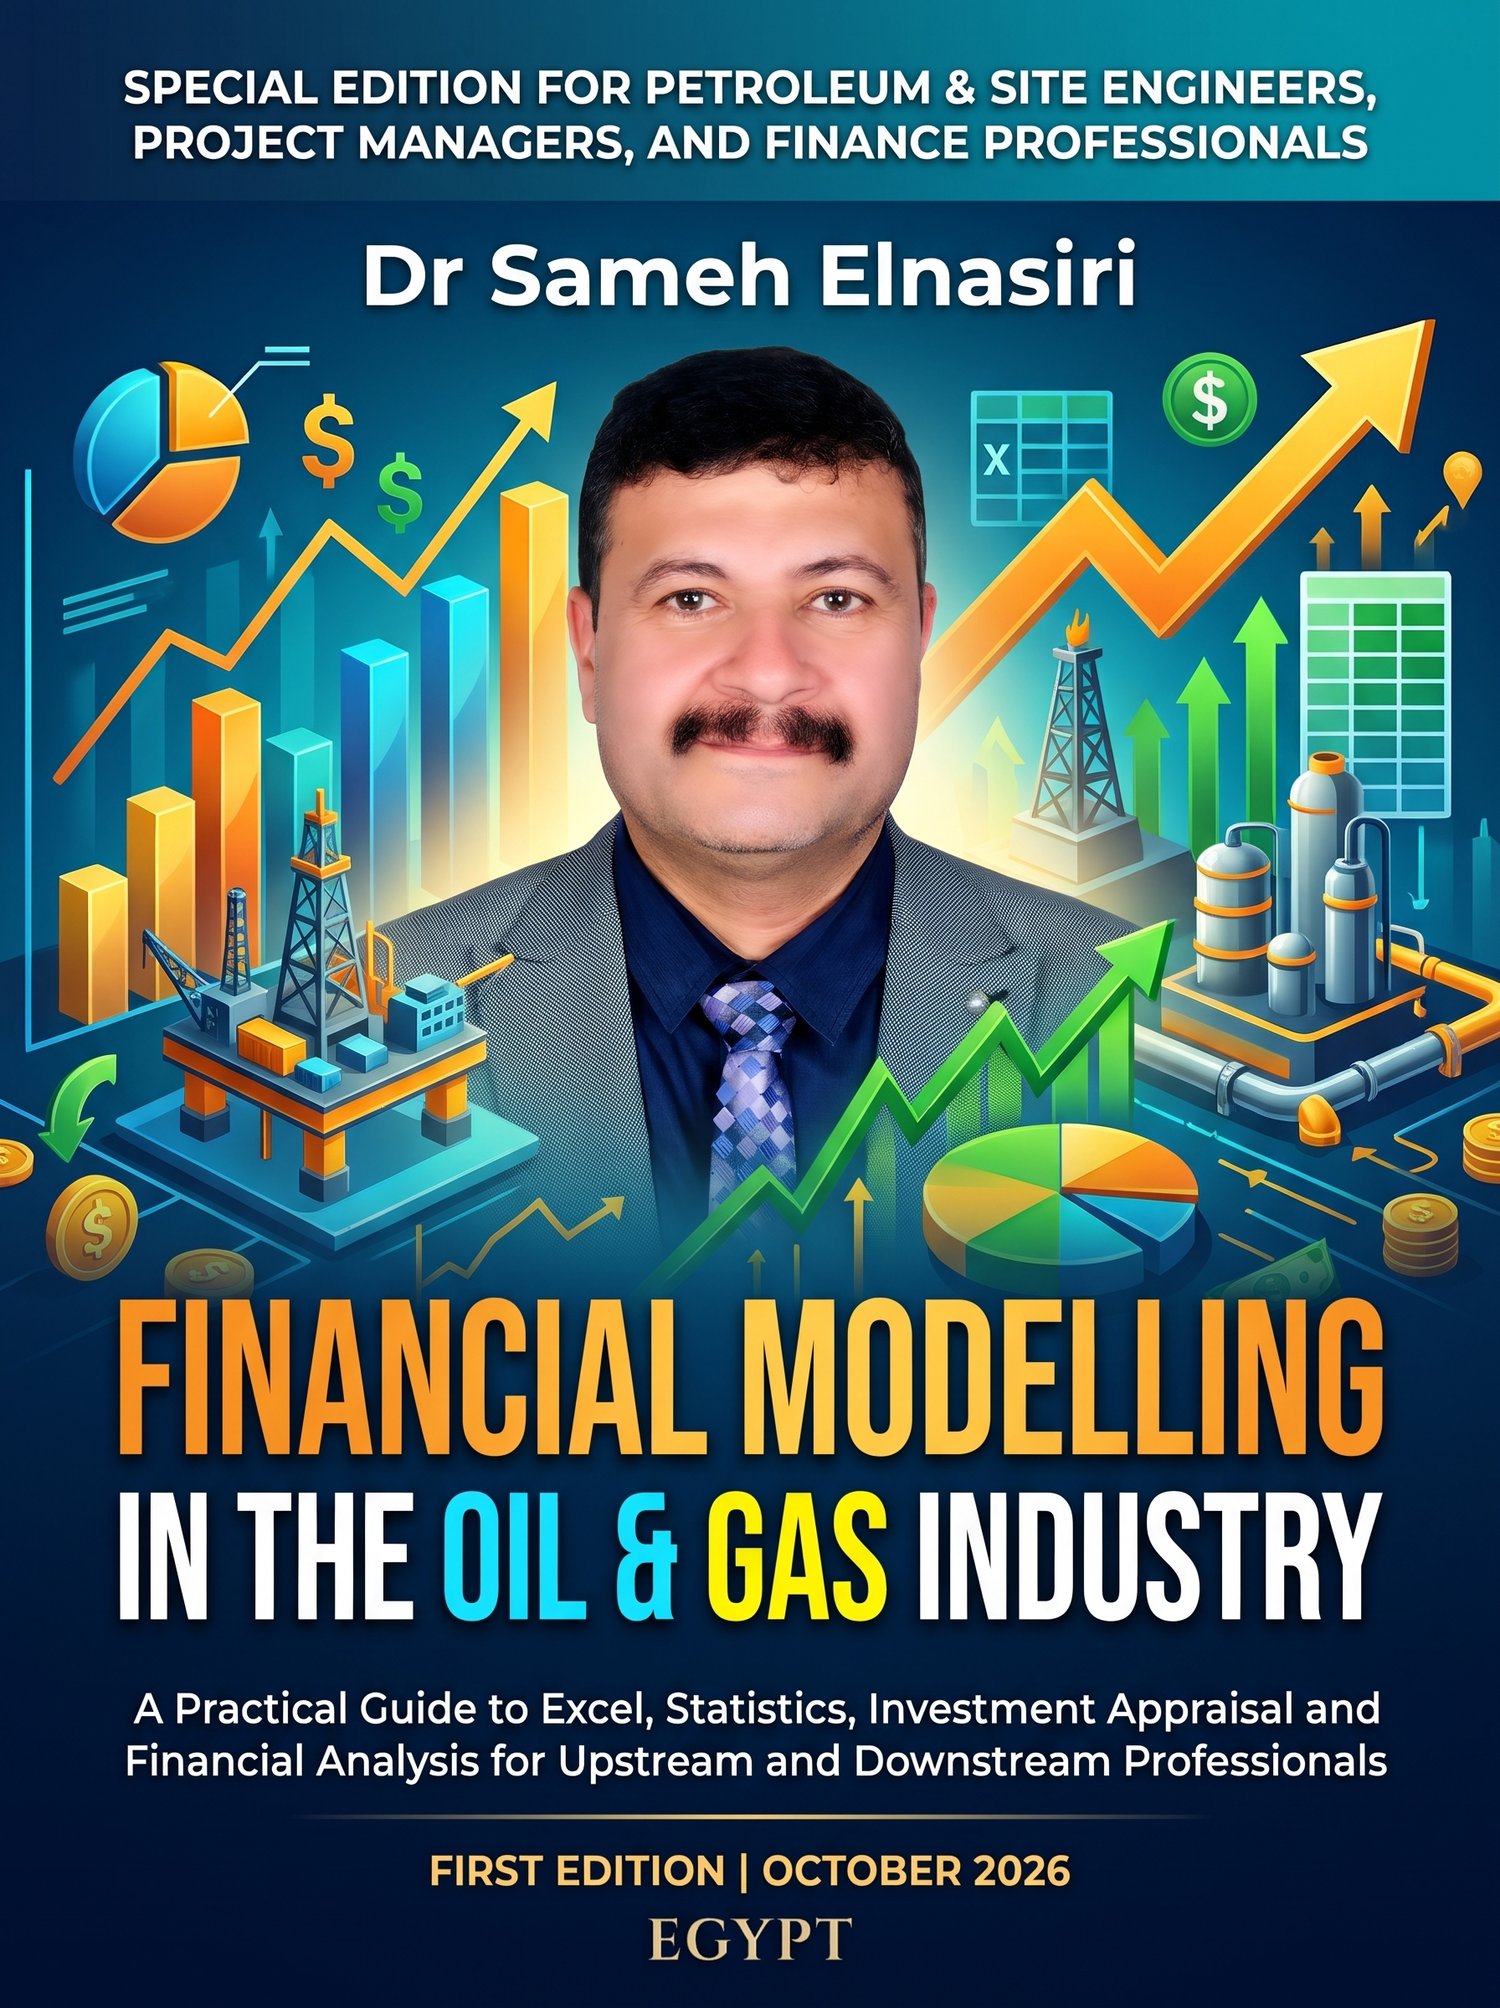
Financial Modelling in the Oil & Gas Industry A Practical Guide to Excel, Statistics, Investment Appraisal and Financial Analysis for Upstream and Downstream Professionals
Dedication
To the petroleum engineers in the field sites, on the rigs, platforms and plants, far from home, in the heat of the desert and the wind of the sea, who turn reservoirs into energy and plans into reality, often unseen.
And to the project managers who carry the weight of schedules, budgets and safety on their shoulders, and who must make big decisions with uncertain numbers.
This book is for you. May it make your numbers clearer and your decisions stronger.
Dr. Sameh Elnasiri
Contents
Introduction: About This Book 4
Welcome to This Book 4
Why This Book Matters 5
Excel and Digital Tools in Modern Practice 5
How This Book Is Organised 6
The Training Examples 7
Software Requirements and Conventions 8
How to Get the Most from This Book 8
Day 1: Introduction to the Excel Environment with Oil and Gas 9
1.1 A Quick-start Tutorial for Excel 10
1.2 Describing Data Sets Using Statistics 15
1.3 Representing Data Sets Graphically 19
1.4 Understanding the Concept of Normal Distribution and Practical Application 22
1.5 Trend Analysis Using Excel 25
1.6 Time Series Analysis 28
Day 1 Lab Guide: Build an Oil Price and Production Workbook 32
Day 1 Case Study: The Budget Price Nobody Questioned 34
Day 1 Practice Problems with Solutions 36
Day 1 Practical Checklist 38
Day 1 Summary 39
Day 1 Review Questions 39
Day 2: Statistical Analysis (Applied to the Oil and Gas Industry) Using Excel 41
2.1 Use of Excel Functions for Statistical Analysis 42
2.2 Descriptive Statistics and Their Applications: Mean, Median, Standard Deviation, Skewness, Kurtosis 46
2.3 Use of Scatter Diagrams, Frequency and Histogram Distribution 50
2.4 Regression Techniques to Calculate the Cost of Equity Financing 54
2.5 Analysis of Equity Returns of Oil and Gas Industry and Companies 60
Day 2 Lab Guide: Estimate the Cost of Equity for an Oil Company 65
Day 2 Case Study: Which Discount Rate? 67
Day 2 Practice Problems with Solutions 69
Day 2 Practical Checklist 70
Day 2 Summary 71
Day 2 Review Questions 71
Day 3: Oil Product Spreads 73
3.1 Examining the Relationship between Energy Products 74
3.2 Differences between Data Sets and Their Importance 78
3.3 Correlation Analysis 82
3.4 Confidence Intervals 86
3.5 Application of Analysis of Variance (ANOVA) 88
Day 3 Lab Guide: Analyse Refining Spreads 92
Day 3 Case Study: The Underperforming Refinery 93
Day 3 Practice Problems with Solutions 95
Day 3 Practical Checklist 96
Day 3 Summary 97
Day 3 Review Questions 98
Day 4: Investment Appraisal Using Excel 99
4.1 Investment Appraisal Using NPV, IRR and Payback as Applied to the Oil and Gas Industry 100
4.2 Use of Excel Functions for Investment Appraisal: IRR, PV and NPV 104
4.3 Modified Internal Rate of Return (MIRR) 108
4.4 Use of Scenario Analysis and Stress Testing 111
4.5 Predicting Financial Distress 116
Day 4 Lab Guide: Appraise and Stress-Test a Field Development 122
Day 4 Case Study: Two Projects, One Budget 123
Day 4 Practice Problems with Solutions 125
Day 4 Practical Checklist 126
Day 4 Summary 127
Day 4 Review Questions 127
Day 5: Financial Analysis in the Up and Down Stream Oil and Gas Industry 129
5.1 Introduction to Financial Statements 130
5.2 Ratio Analysis Applied to the Oil and Gas Industry 135
5.3 Ratios as a System – Pyramids of Ratios 140
5.4 Financial Modelling 144
5.5 Cash Flow Forecasts Using Excel 149
Day 5 Lab Guide: Analyse and Forecast an Oil Company 156
Day 5 Case Study: Same Industry, Different Stories 157
Day 5 Practice Problems with Solutions 159
Day 5 Practical Checklist 160
Day 5 Summary 161
Day 5 Review Questions 161
Conclusion: Bringing It All Together 163
The Journey of the Five Days 163
Five Lessons to Take Back to Work 164
From Learning to Practice 165
A Final Word 165
References: Standards, Books and Articles 166
Standards and Professional Frameworks 166
Books 166
Journal Articles 168
Software Documentation 169
A Note on Currency of Information 169
Appendix A: Key Formulas 170
Statistics and Forecasting 170
Relationships, Intervals and Tests 171
Cost of Capital and Returns 171
Spreads and Refining 171
Investment Appraisal 172
Financial Analysis and Distress 172
Appendix B: Excel Function Reference 174
Core Functions 174
Data and Dynamic Array Functions 174
Statistical Functions 175
Financial Functions 175
Tools 176
Useful Keyboard Shortcuts 177
Appendix C: Glossary of Key Terms 178
Appendix D: Answers to Review Questions 182
Day 1 Answers 182
Day 2 Answers 182
Day 3 Answers 183
Day 4 Answers 183
Day 5 Answers 184
Appendix E: Practical Templates 185
Template 1: Model Cover Sheet 186
Template 2: Inputs Sheet Layout 187
Template 3: Descriptive Statistics Summary 188
Template 4: Investment Decision Summary 189
Template 5: Ratio Dashboard 190
Template 6: Monthly Cash Forecast 191
Template 7: Model Review Checklist 192
Template 8: Personal Action Plan 193
Appendix F: Post-Course Assessment 194
Questions 194
Answer Key 196
INTRODUCTION
About This Book
Welcome to This Book
Welcome to Financial Modelling in the Oil & Gas Industry. This book grew out of a five-day professional training programme that I have delivered to finance, planning and technical professionals in the oil and gas sector. It keeps the structure of that programme: five parts, called Day 1 to Day 5, each made up of practical topics with worked examples, exercises and review questions. You can read it from start to finish as a self-study course, or keep it on your desk as a reference and open the chapter you need. Wherever the text mentions "the course", it refers to this five-day programme.
We have written the book in simple, clear English. Many people think that financial modelling and statistics are difficult subjects. In fact, most of the ideas are simple. A model takes a few sensible assumptions, turns them into numbers with clear formulas, and presents the results so that someone can make a better decision. Statistics helps us describe data honestly and measure how uncertain our numbers are. The hard part is not the mathematics. The hard part is being organised, careful and honest about what the numbers can and cannot tell us. This book tries to make that part easier.
The oil and gas industry is an excellent place to learn these skills. Prices change every day, projects cost billions and last for decades, and small differences in assumptions can change a decision from "yes" to "no". People who can build clear models, read data correctly and explain risk in plain language are valuable in every part of the industry, from exploration and production to refining, trading, planning and finance.