

Catering Business Profit Tracker
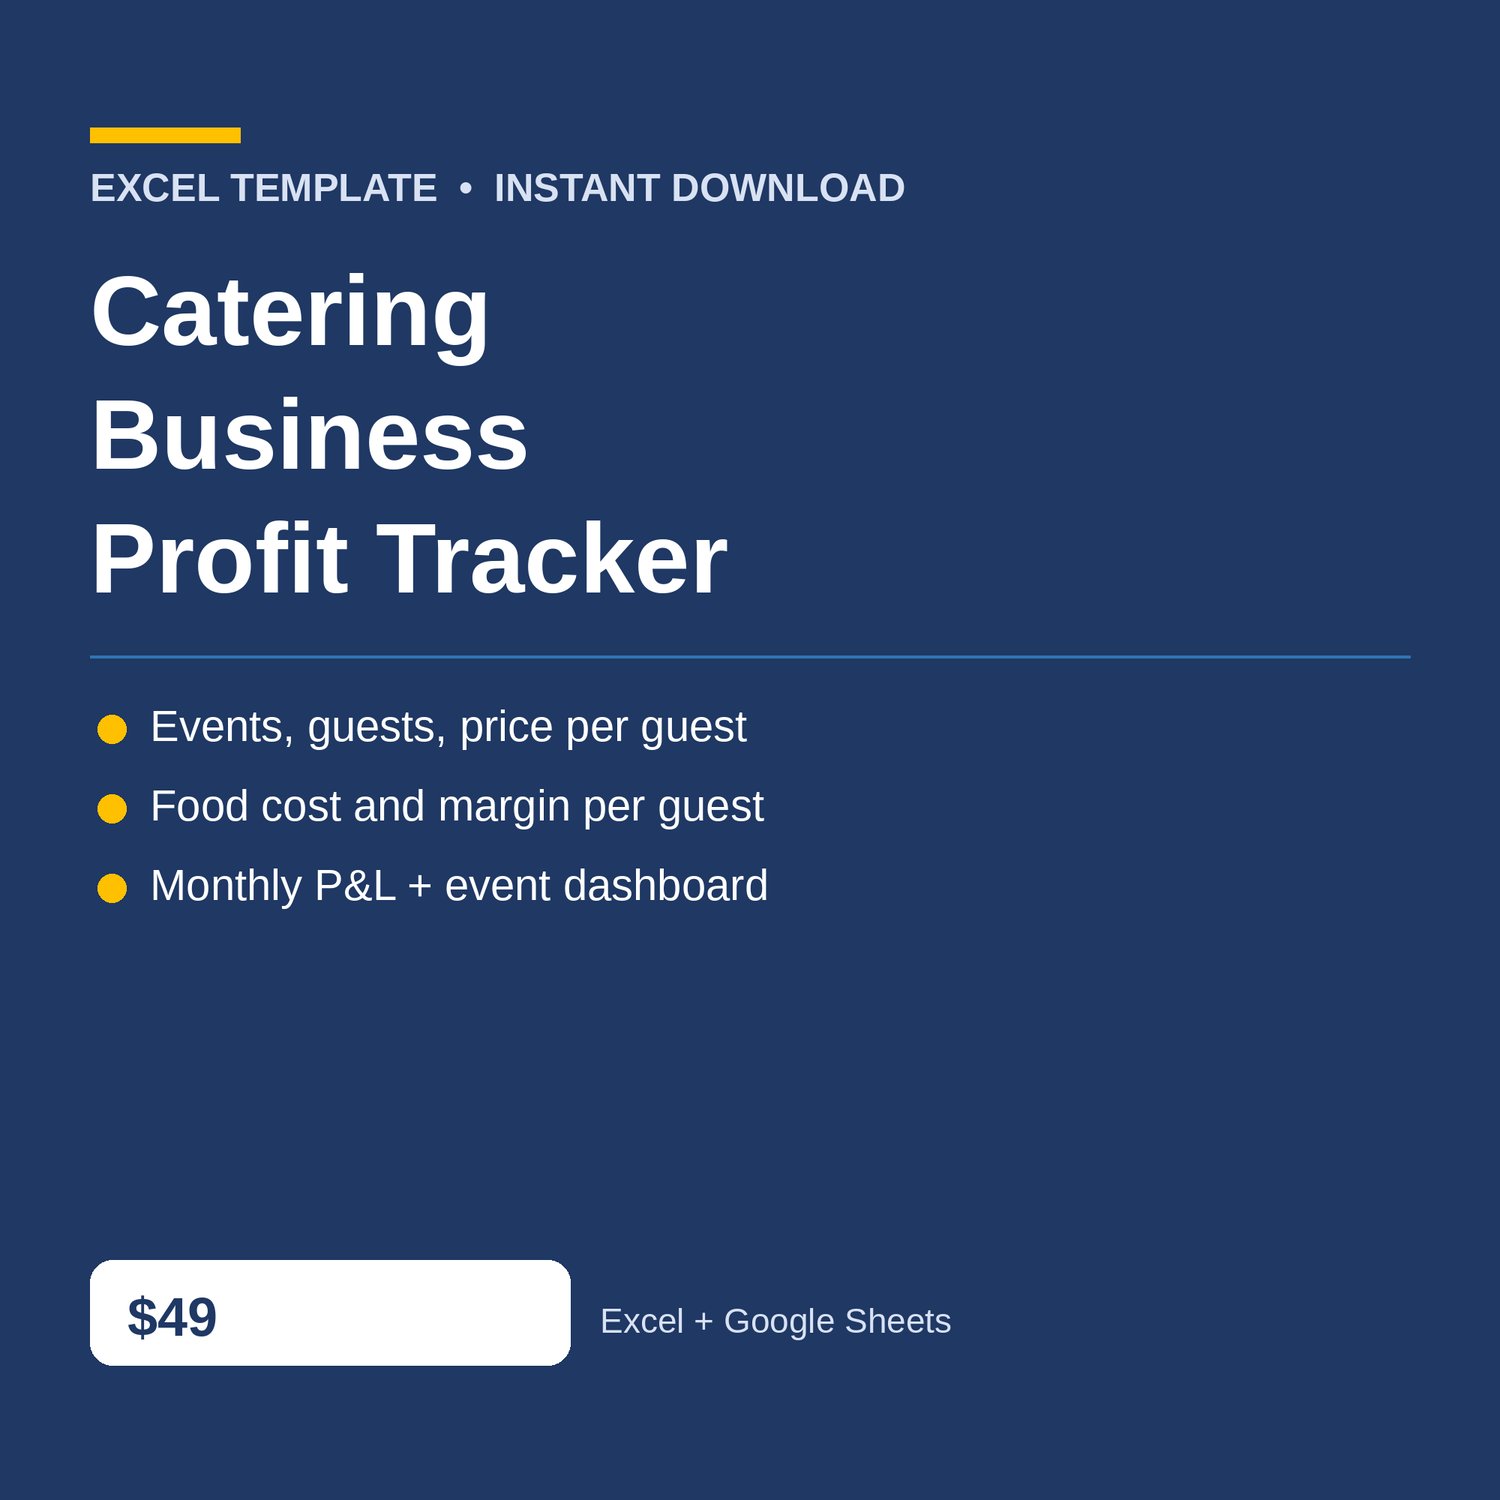
Catering Business Profit Tracker Excel for your events — events and guests, food cost, and a monthly P and L dashboard. Know what every guest actually earns — and whether the month actually made money.
Built for caterers and small catering companies who need to know, events by events and guests by guests, what food really costs — without accounting software. If a big community picnic is feeding 180 guests at barely above food cost, this workbook shows it before the next quote goes out.
WHAT'S INCLUDED (6 sheets):
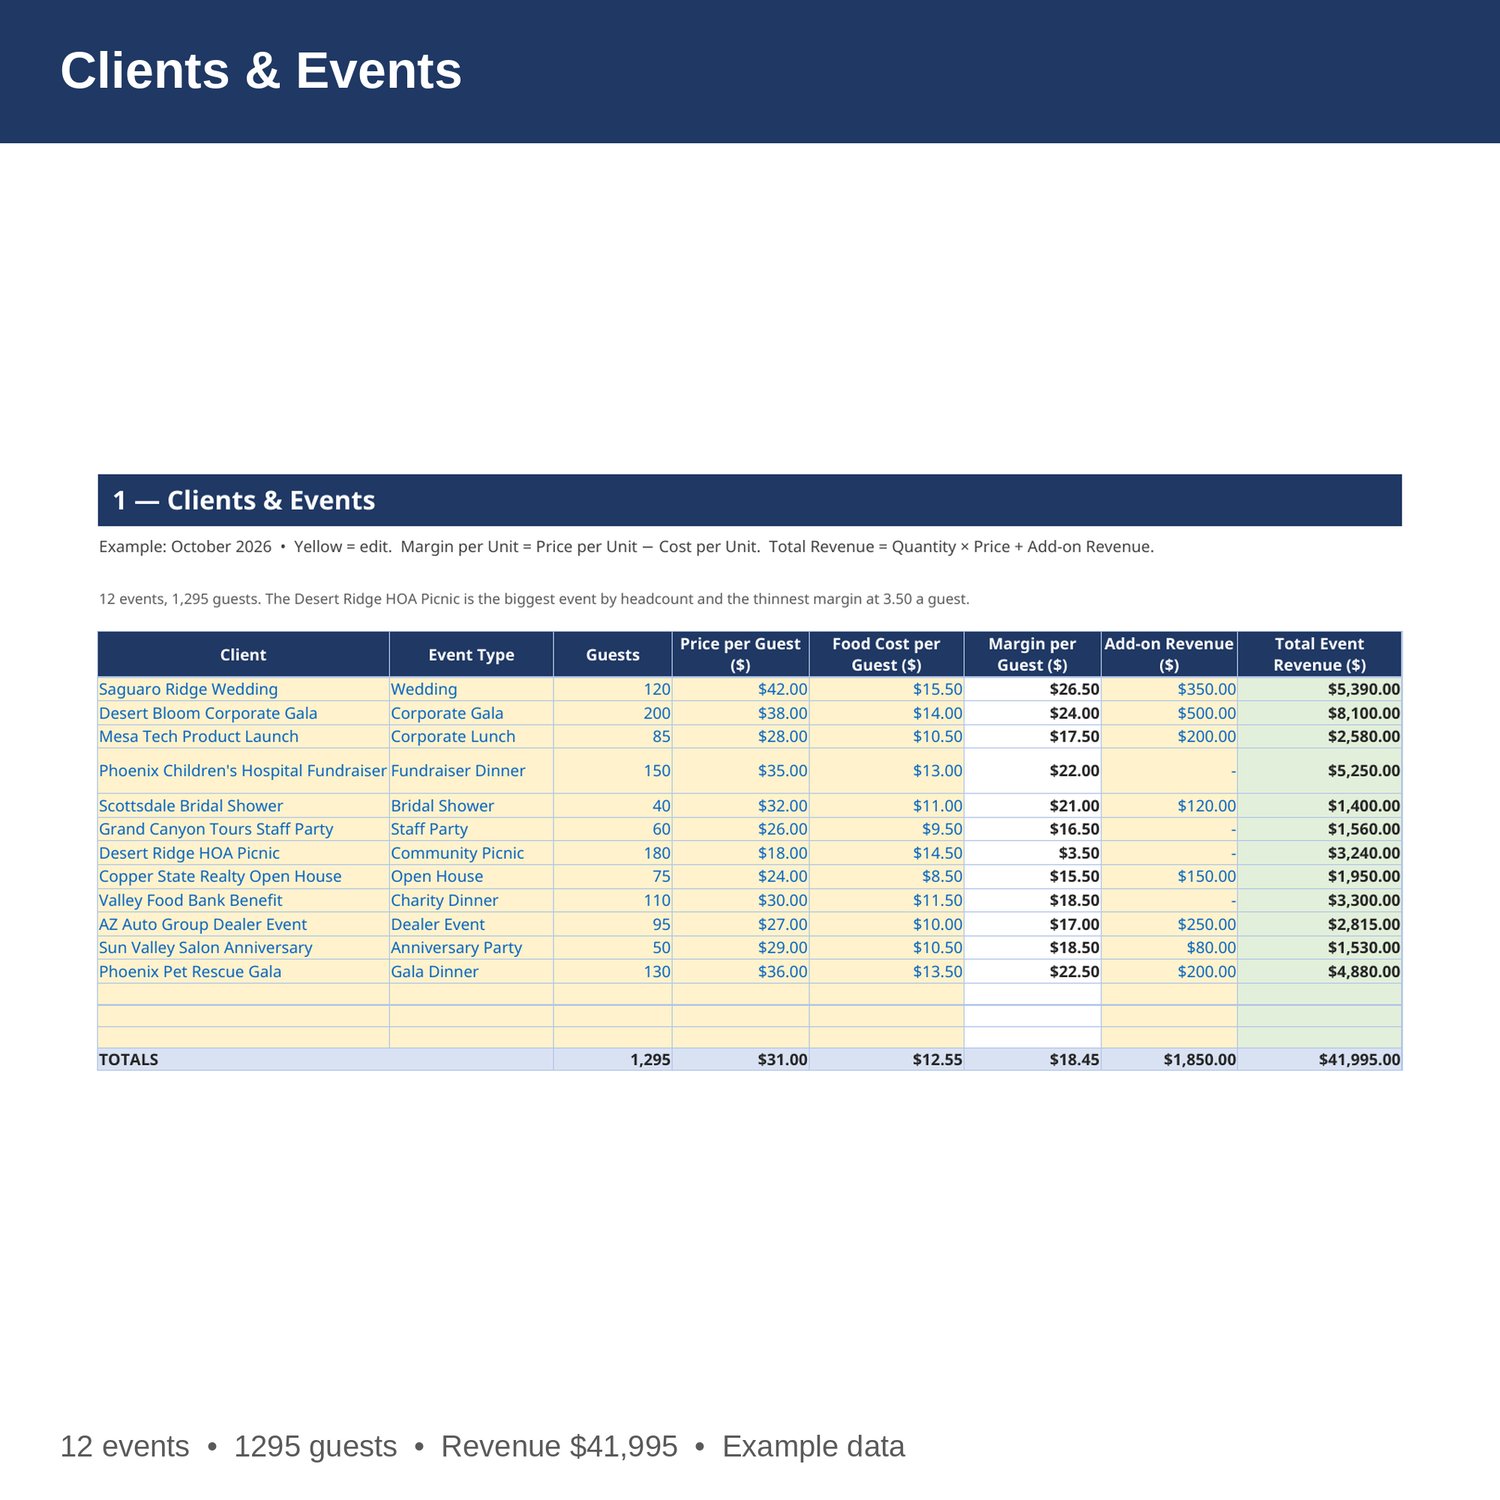
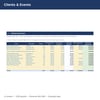
- Clients & Events — client, event type, guests, price per guest, food cost per guest, margin per guest, add-on revenue, and total event revenue, for 12 events.
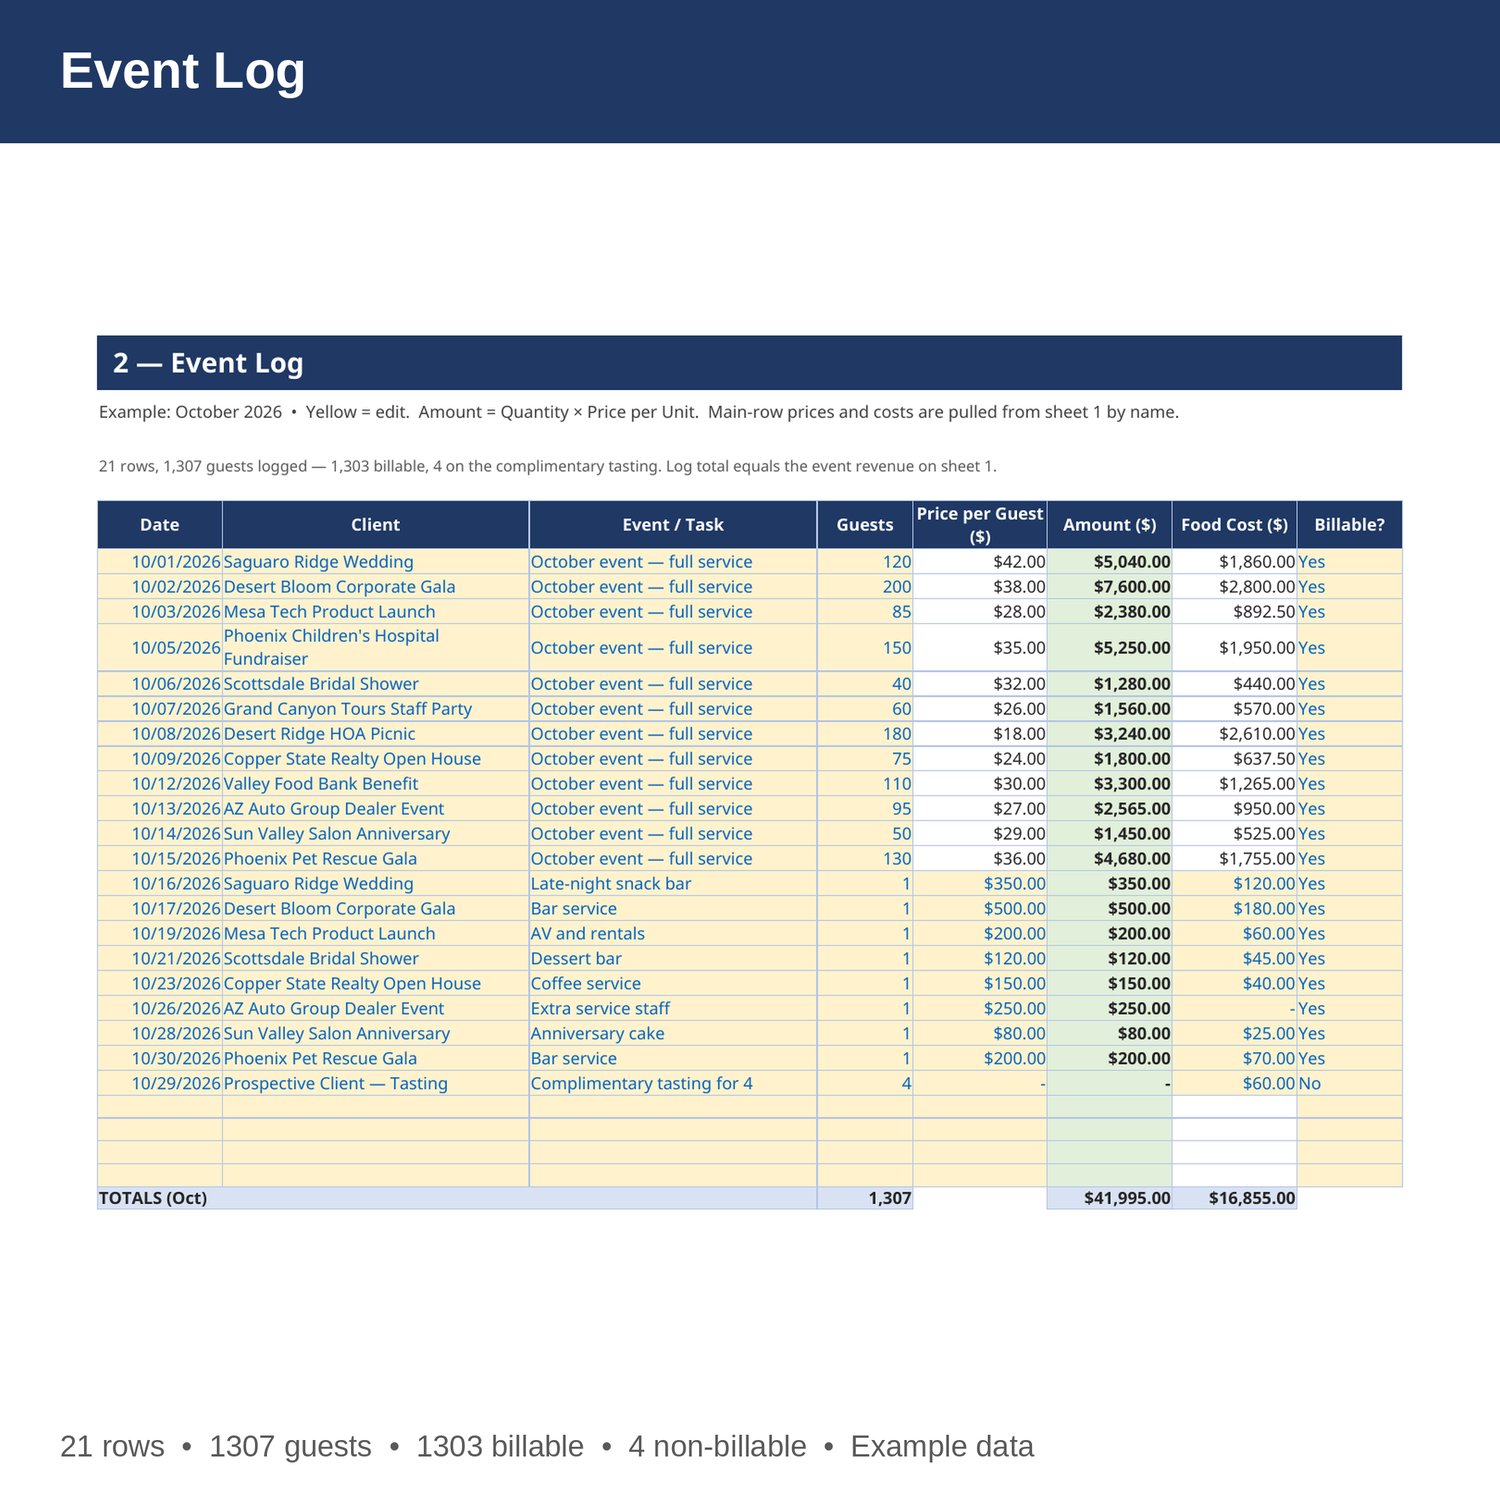
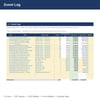
- Event Log — date, client, event or task, guests, price per guest, amount, food cost, and billable flag, for 21 rows in October 2026 (12 events, 8 add-on services, 1 complimentary tasting).
- Expenses — item, category, unit, quantity per month, cost per unit, monthly cost, and notes, for 12 expense items.
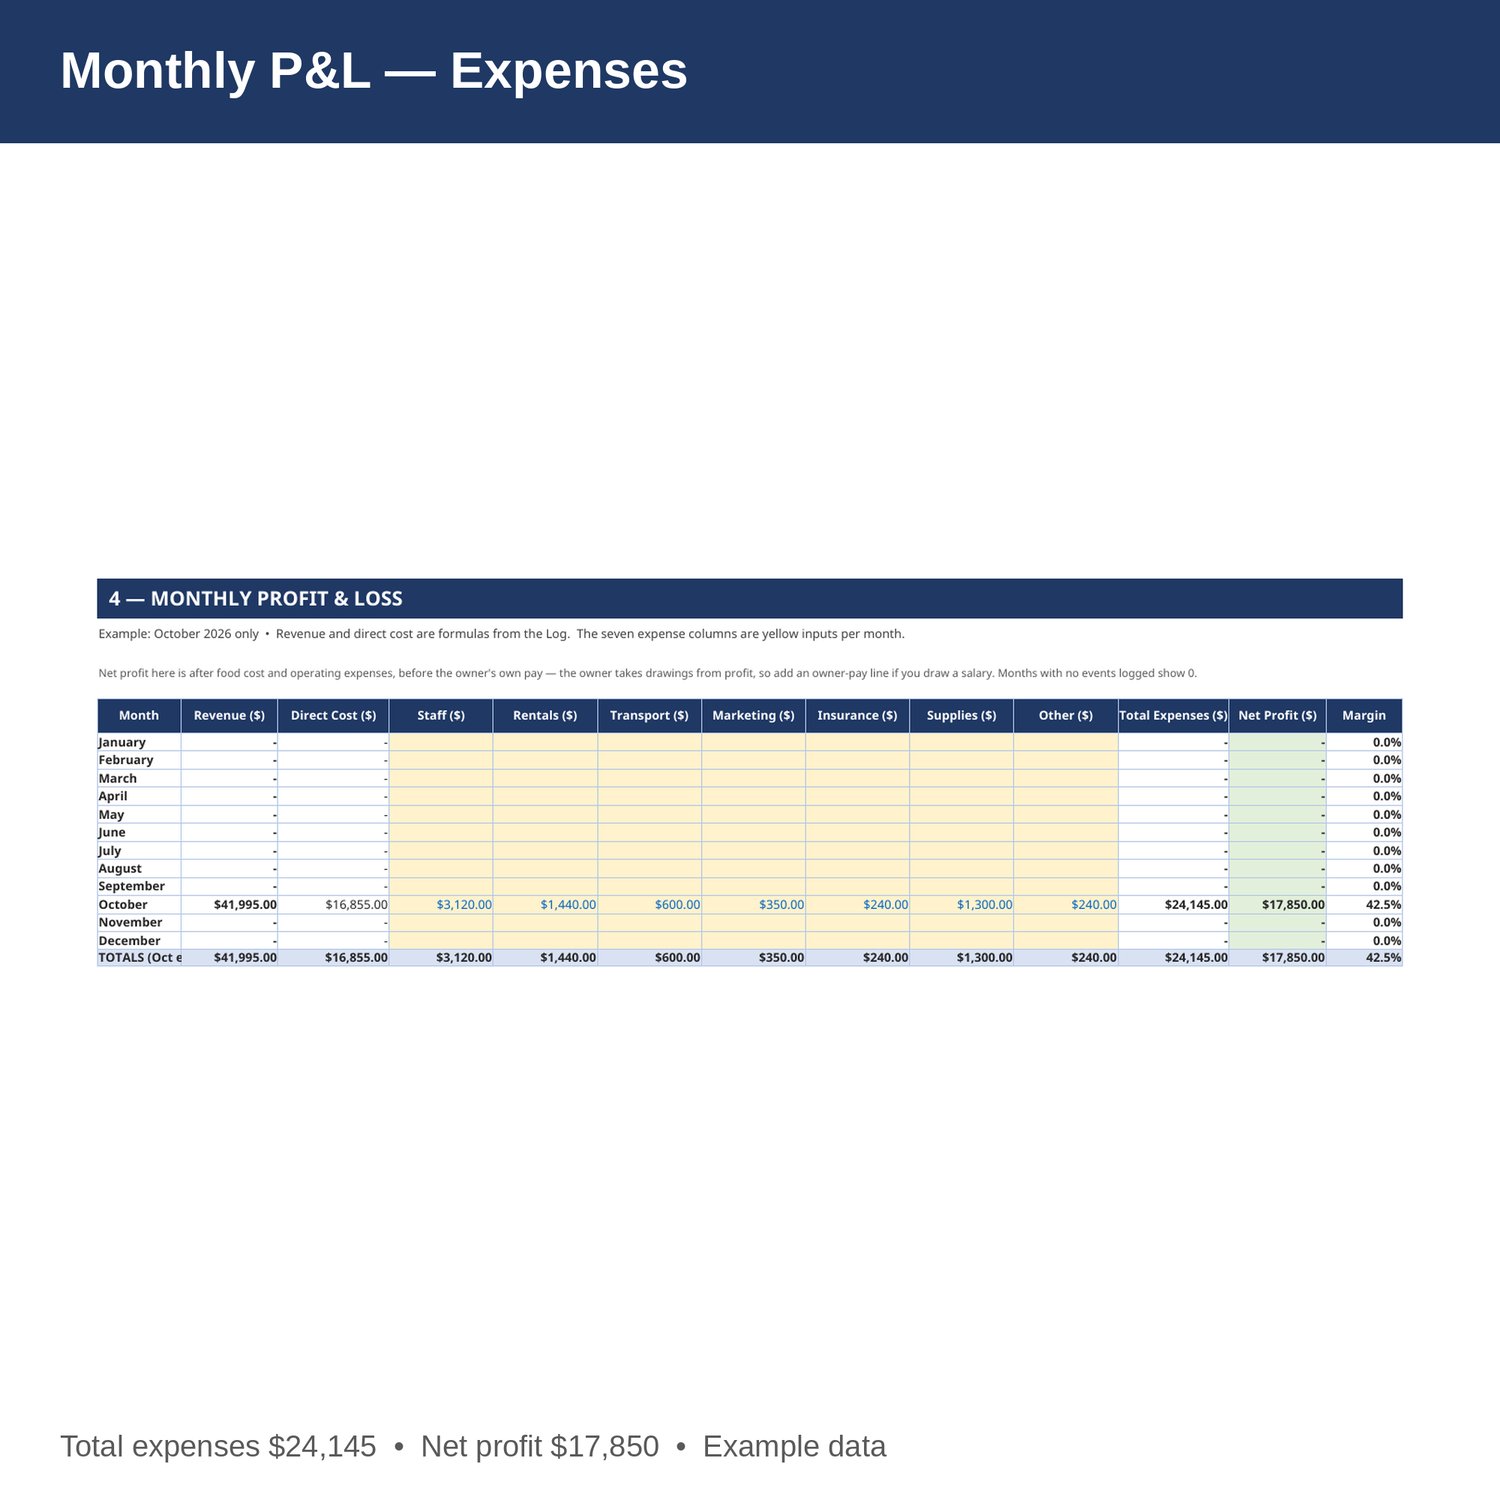
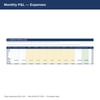
- Monthly P and L — revenue, food cost, staff, rentals, transport, marketing, insurance, supplies and other expenses by month, Jan-Dec, with net profit and margin. Revenue and food cost are formulas from the Event Log.
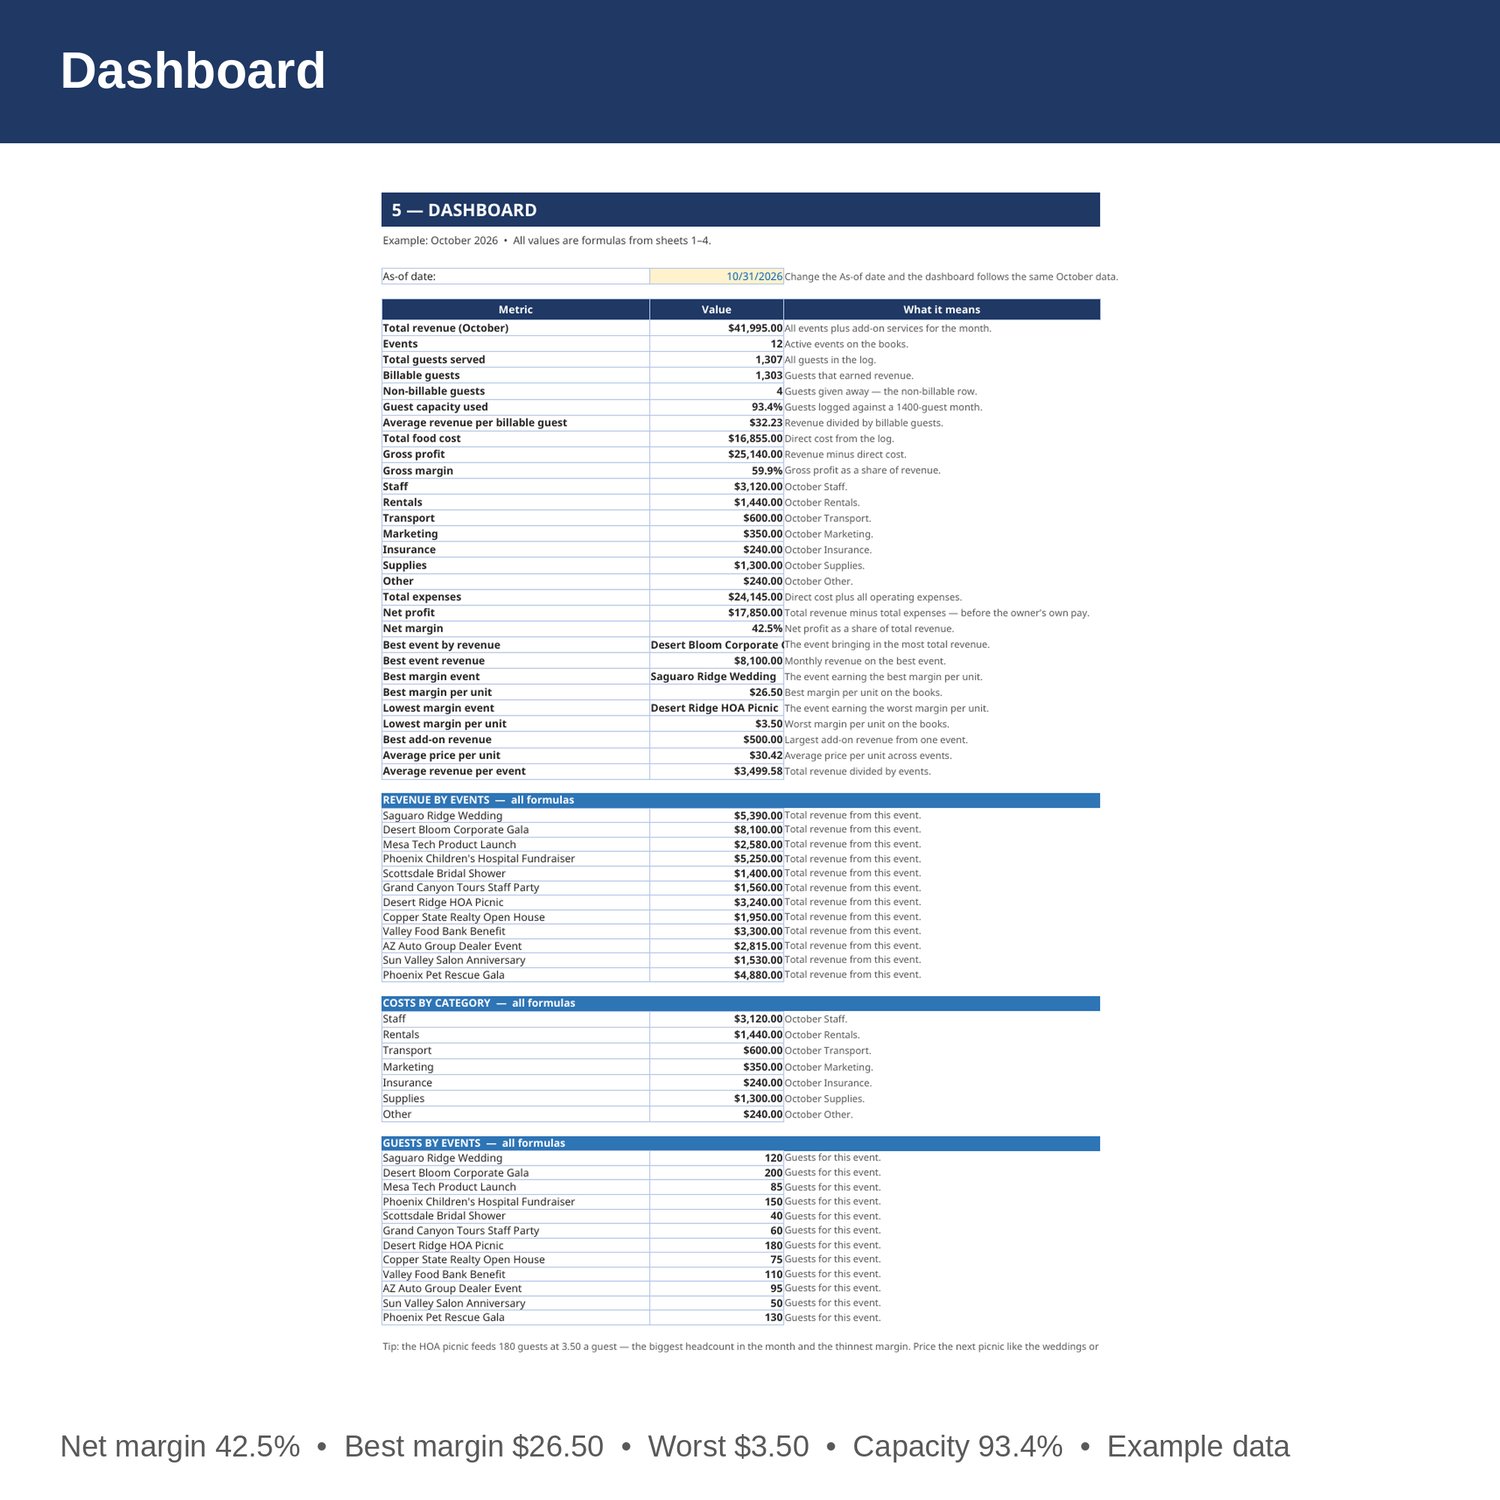
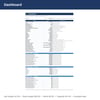
- Dashboard — total revenue, events, guests, billable vs non-billable guests, capacity used, average revenue per guest, food cost, gross profit and margin, expenses, net profit and margin, best and weakest events, revenue by event, costs by category, and guests by event.
- Cover and How to Use — start here. Yellow cells are the only ones you edit.
EXAMPLE DATA (October 2026 — replace with your own numbers):
- 12 events; 1295 guests; base revenue 40,145; add-on revenue 1,850; total revenue 41,995.
- 1307 guests logged (1303 billable, 4 non-billable); capacity used 93.4 percent of a 1400-guest month; average revenue per billable guest 32.23.
- Direct cost 16,855; gross profit 25,140; gross margin 59.9 percent.
- staff 3,120, rentals 1,440, transport 600, marketing 350, insurance 240, supplies 1,300, other 240; total expenses 24,145; net profit 17,850; net margin 42.5 percent.
- Best event by revenue: Desert Bloom Corporate Gala, 8,100. Best margin: Saguaro Ridge Wedding, 26.50 per unit. Lowest margin: Desert Ridge HOA Picnic, 3.50 per unit.
- Average price per unit 30.42; average revenue per event 3,499.58; best add-on revenue 500 (Desert Bloom Corporate Gala).
HOW IT WORKS:
1. Download the Excel file instantly after purchase.
2. On sheet 1, enter each event's event type, quantity, price per unit, cost per unit, and add-on revenue. Margin per unit and total revenue fill in by formula.
3. On sheet 2, add a row per event: date, event (spelled exactly as on sheet 1), task, quantity, price per unit, and whether it was billable. Amount and cost fill in by formula. Main rows pull the price and cost from sheet 1.
4. On sheet 3, enter each month's item, quantity, and cost per unit.
5. On sheet 4, enter the seven expense columns each month, then check gross profit, capacity and net profit on the Dashboard.
HOW THE NUMBERS WORK:
Margin per unit is price per unit minus cost per unit. Total revenue is quantity times price plus add-on revenue. Gross profit is revenue minus direct cost. Average revenue per billable guest is total revenue divided by billable guests. Capacity used is guests logged divided by a 1400-guest month. Net profit is revenue minus direct cost and staff, rentals, transport, marketing, insurance, supplies, other — before the owner's own pay, which comes out of profit as drawings.
WHO IT'S FOR:
Caterers, event caterers, and small catering companies who want event revenue, food cost per guest, margin per guest, and a monthly P and L in one workbook — without accounting software.
PLEASE NOTE:
- This is a digital download. No physical item will be shipped.
- Works in Microsoft Excel and Google Sheets (upload to Google Drive to open in Sheets).
- Example data for October 2026 is included (12 events, 1295 guests, 1307 guests logged in total, 12 expense items). Replace it with your own numbers.
- The example is simplified: net profit is before the owner's own pay — the owner takes drawings from profit, so add an owner-pay line on the P and L if you draw a salary. Capacity is measured against a 1400-guest month; change it on the Dashboard if your month is different.
- This is a bookkeeping and planning tool only, not tax, legal, or CPA advice.
- Due to the nature of digital downloads, refunds are not available. Message me before buying if you have a question.
Built by an accountant: B.S. Accountancy, ASU W. P. Carey, with revenue-reconciliation experience at Marriott and audit work at PwC.