
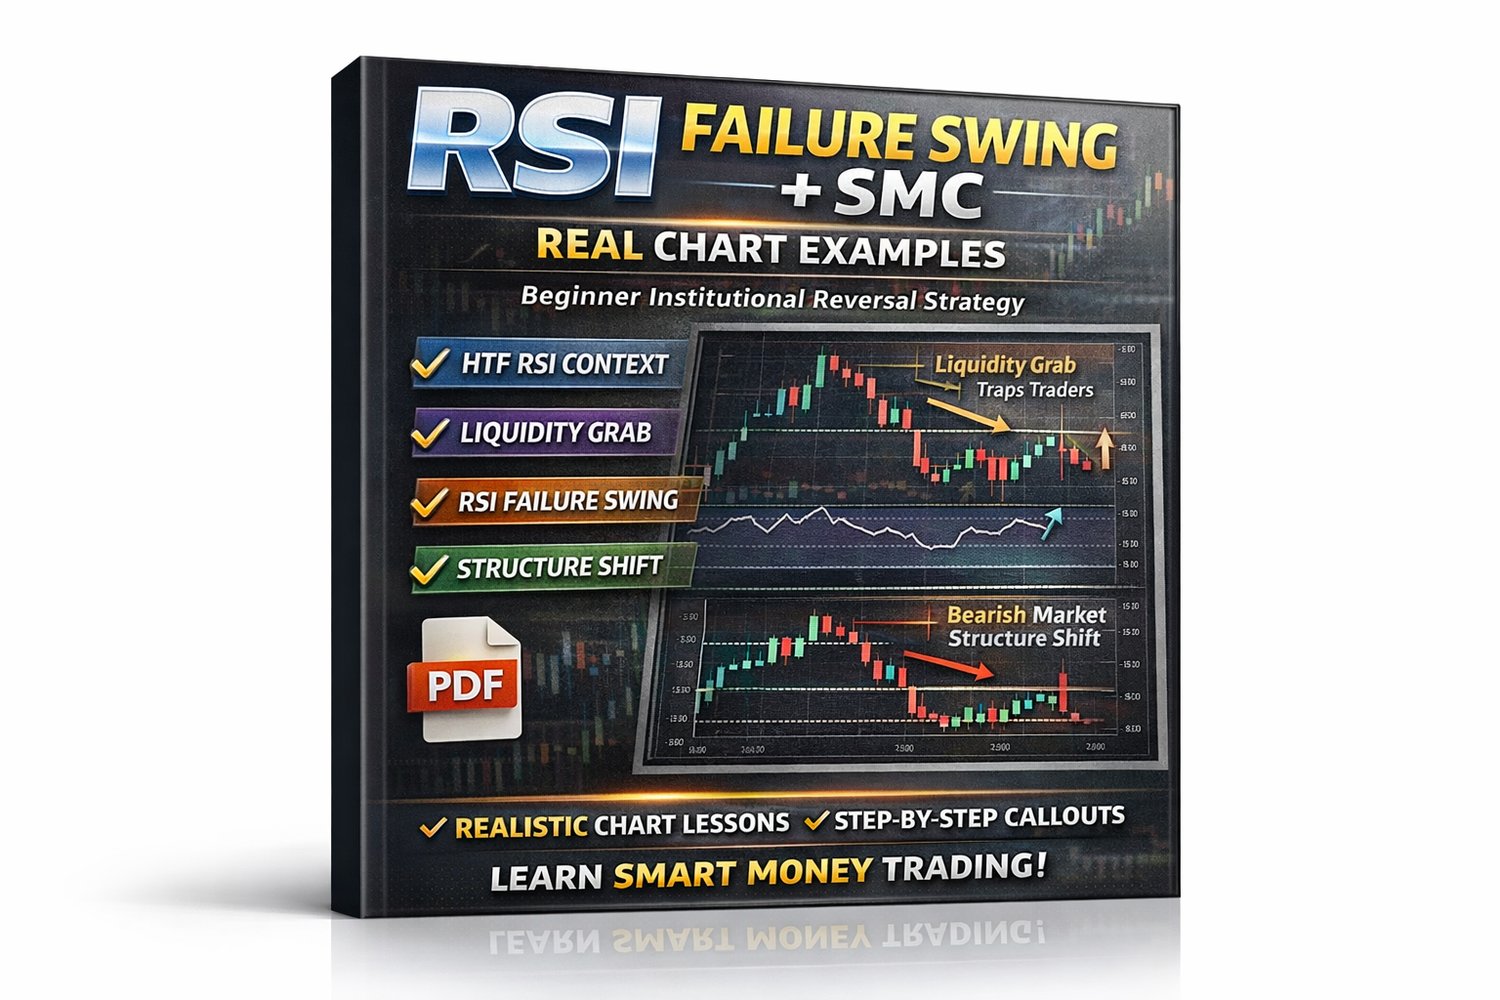
RSI FAILURE SWING + SMART MONEY TRAP A Beginner-Friendly Institutional Reversal Strategy
📘
RSI FAILURE SWING + SMART MONEY TRAP
A Beginner-Friendly Institutional Reversal Strategy

⚠️ DISCLAIMER
This content is for educational purposes only. Trading involves risk. Always apply proper risk management.
👤 WHO THIS STRATEGY IS FOR
- Traders who enter too early
- Traders trapped by fake breakouts
- RSI users tired of false overbought/oversold signals
- Beginners learning market manipulation
🧠 STRATEGY IDEA (VERY SIMPLE)
Institutions:
- Push price to make RSI look strong
- Fail to continue momentum
- Trap breakout traders
- Reverse price aggressively
👉 RSI Failure Swing reveals this trap
👉 SMC confirms who is trapped
📊 INDICATOR SETUP
- RSI (14)
- Levels: 20 / 40 / 60 / 80
- No other indicators required
📌 RSI failure is more important than RSI level.
⏱️ TIMEFRAME RULES
- Bias: 1H or 4H
- Entry: 5m or 15m
- Best Sessions: London & New York
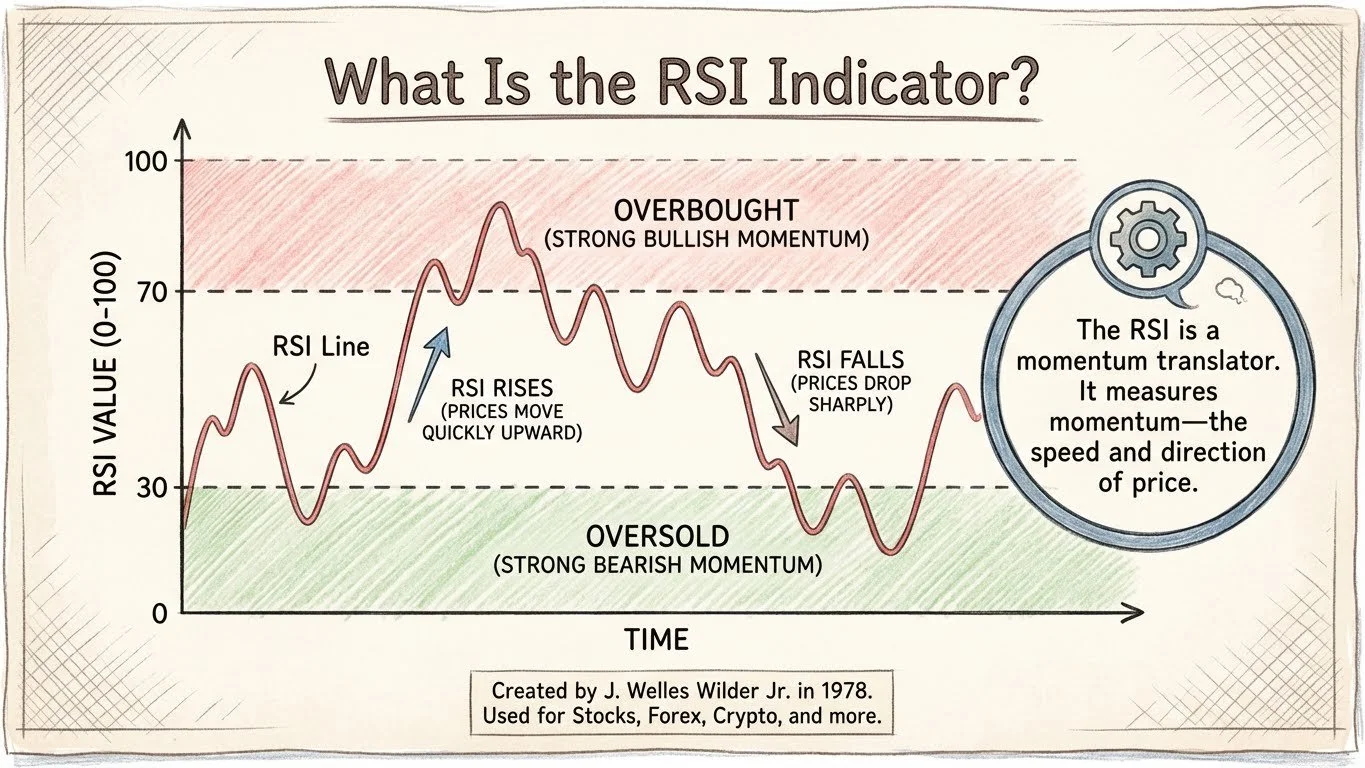
STEP 1️⃣ – HTF RSI CONTEXT
Rules
- RSI near 60–80 → Watch for short setups
- RSI near 20–40 → Watch for long setups
📌 We are not trading trend continuation —
we are trading FAILED momentum.
📊 REAL CHART EXAMPLE – RSI CONTEXT

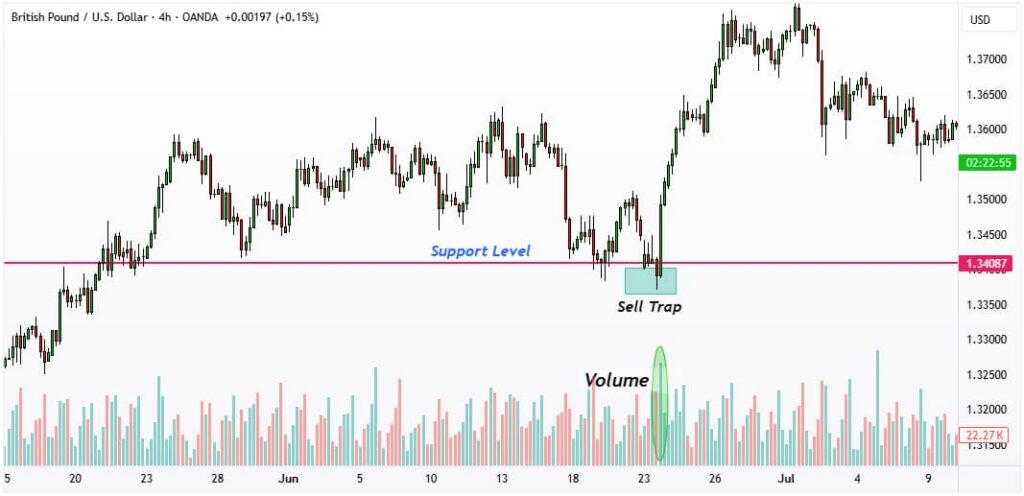
STEP 2️⃣ – LIQUIDITY GRAB (THE BAIT)
Price must:
- Break previous high (for shorts)
- Or break previous low (for longs)
This move attracts:
- Breakout traders
- Late entries
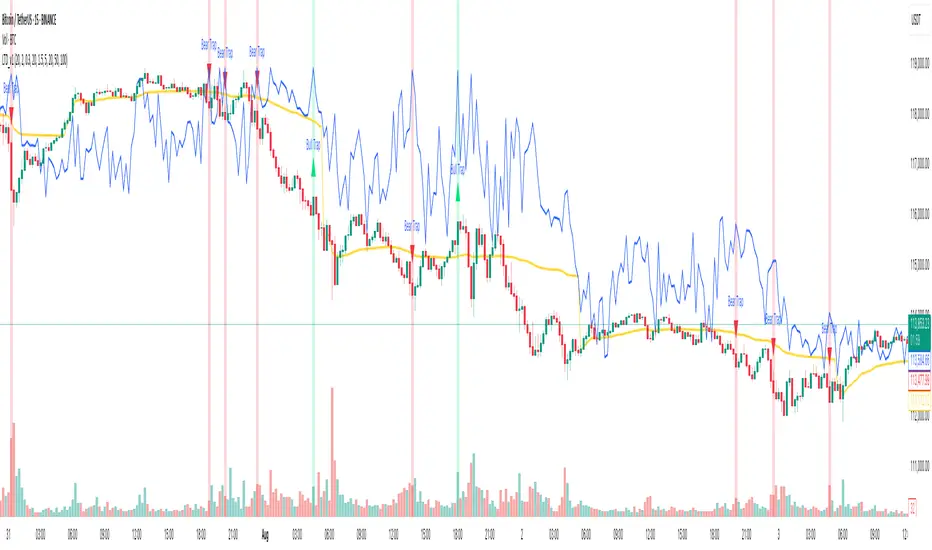
📉 REAL CHART EXAMPLE – LIQUIDITY TRAP
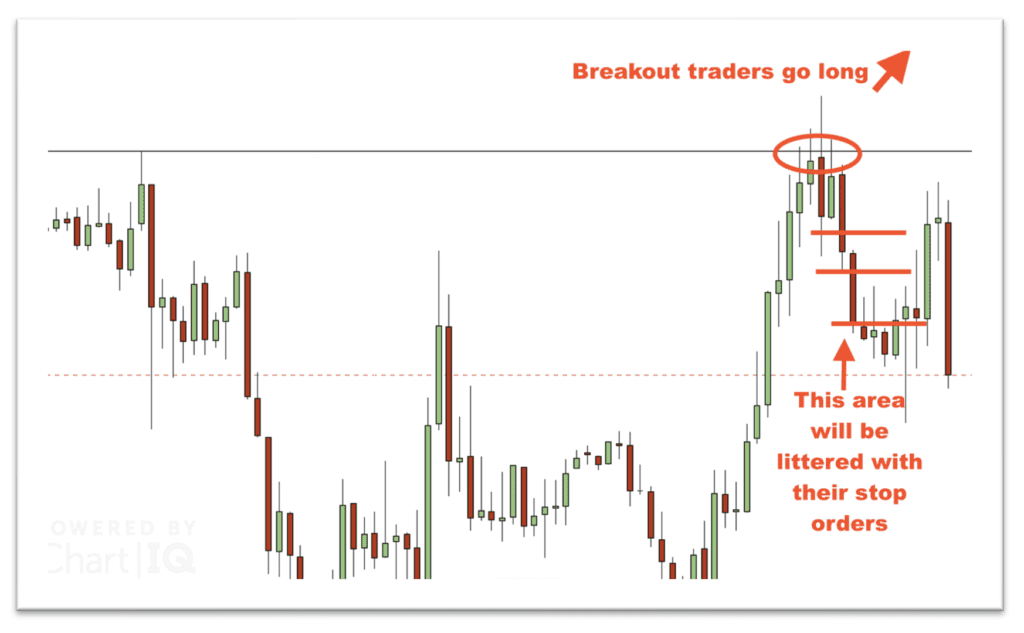

⚠️ This breakout is designed to fail
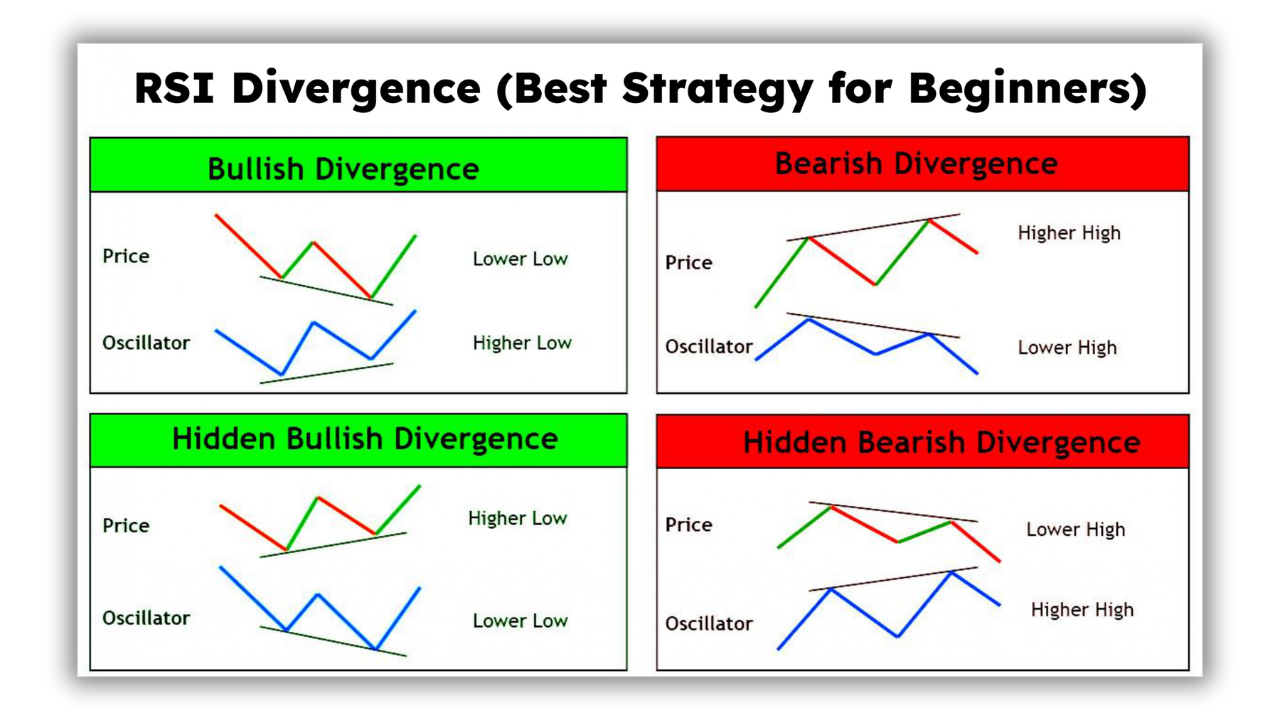
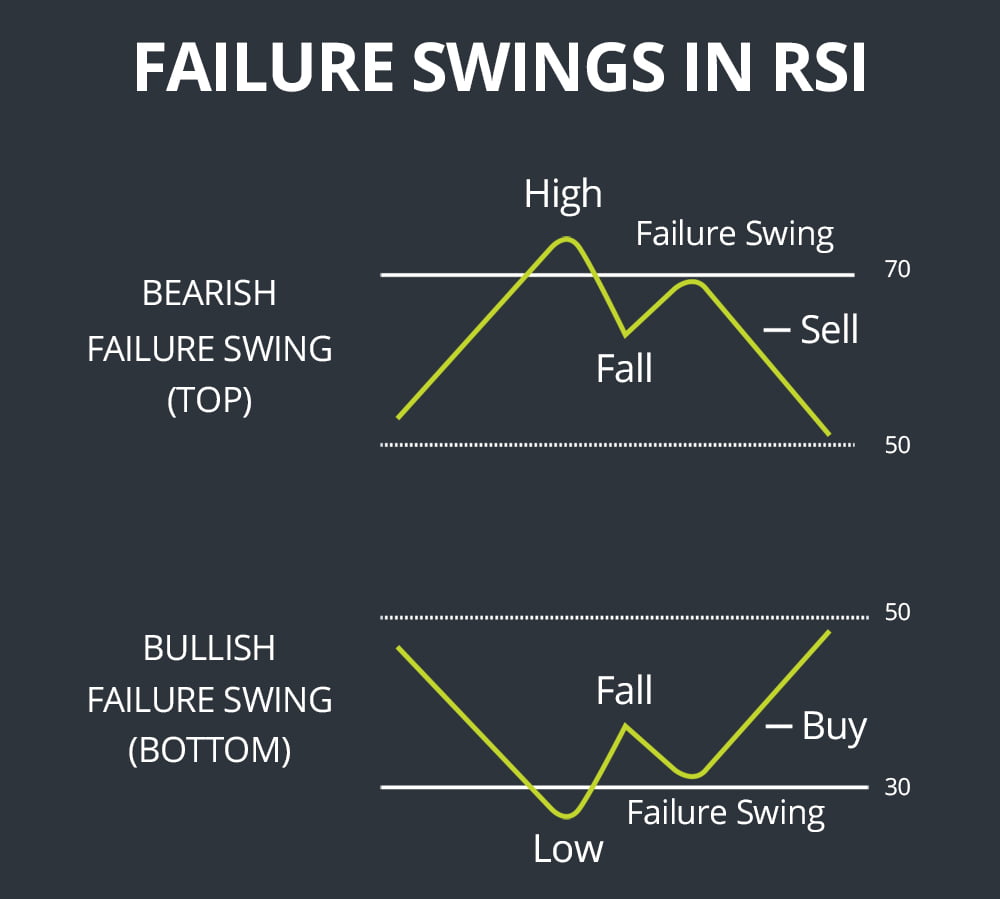
STEP 3️⃣ – RSI FAILURE SWING (KEY SIGNAL)
🔴 BEARISH FAILURE
- RSI makes lower high
- Price makes higher high
🟢 BULLISH FAILURE
- RSI makes higher low
- Price makes lower low
📌 This shows loss of institutional strength
📊 REAL CHART EXAMPLE – RSI FAILURE

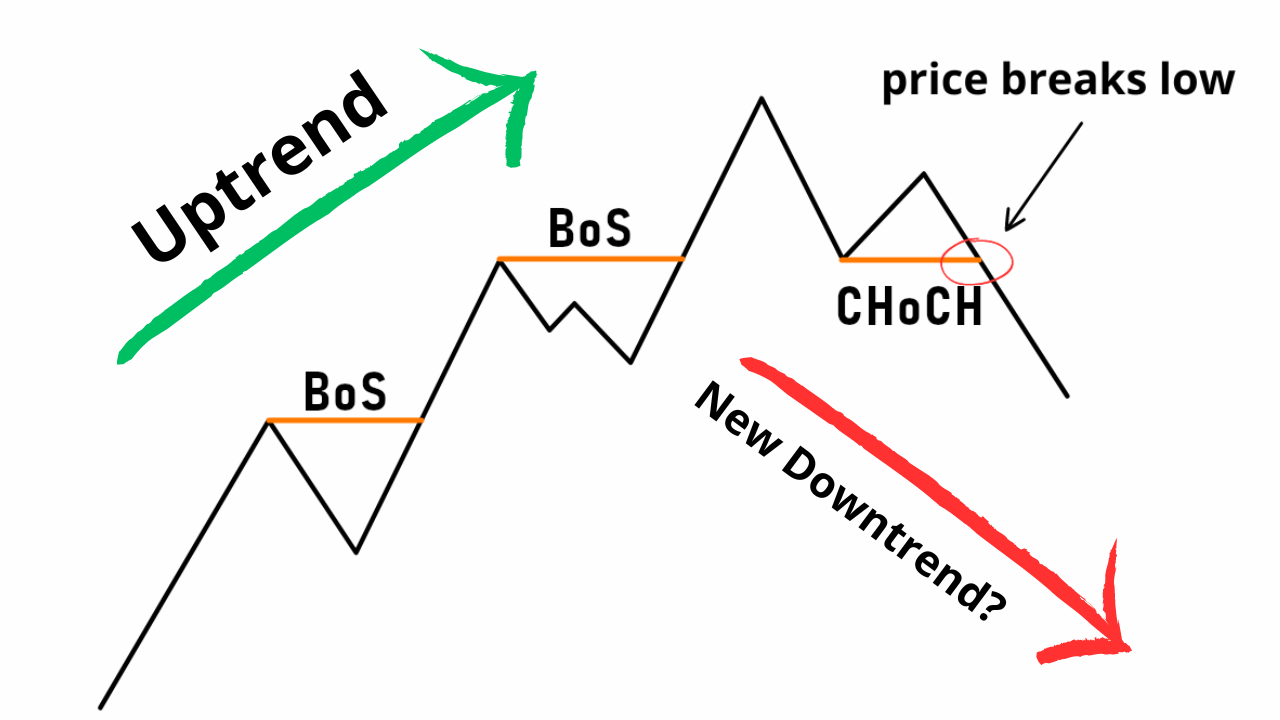
STEP 4️⃣ – SMC STRUCTURE SHIFT
After RSI failure:
- Price must break structure
- Close in the opposite direction
This confirms:
“Smart money has exited the trap.”
📌 REAL CHART EXAMPLE – STRUCTURE SHIFT

🟢 COMPLETE BUY SETUP
✔ RSI near 20–40
✔ Liquidity sweep below lows
✔ RSI forms higher low
✔ Price breaks structure upward
📈 Entry: Bullish candle close
🛑 SL: Below sweep low
🎯 TP:
- Previous high
- Buy-side liquidity
🔴 COMPLETE SELL SETUP
✔ RSI near 60–80
✔ Liquidity sweep above highs
✔ RSI forms lower high
✔ Price breaks structure downward
📉 Entry: Bearish candle close
🛑 SL: Above sweep high
🎯 TP:
- Previous low
- Sell-side liquidity
📏 RISK MANAGEMENT
- Risk 1% per trade
- RR minimum 1:2
- Trade only one setup per session
❌ COMMON BEGINNER MISTAKES
- Selling immediately at RSI 70
- Buying immediately at RSI 30
- Ignoring structure
- Overtrading traps
🧠 ONE-PAGE STRATEGY RECAP
Liquidity grab → RSI failure → Structure shift → Trade
🏆 WHY THIS STRATEGY WORKS
✔ Uses RSI strength failure, not levels
✔ Avoids fake breakouts
✔ Very clear invalidation
✔ Beginner-friendly logic
✔ Perfect companion to RSI Value Re-Entry
Start learning RSI the institutional way — visit my store..: https://payhip.com/DIGITALCREATIONWORLD