
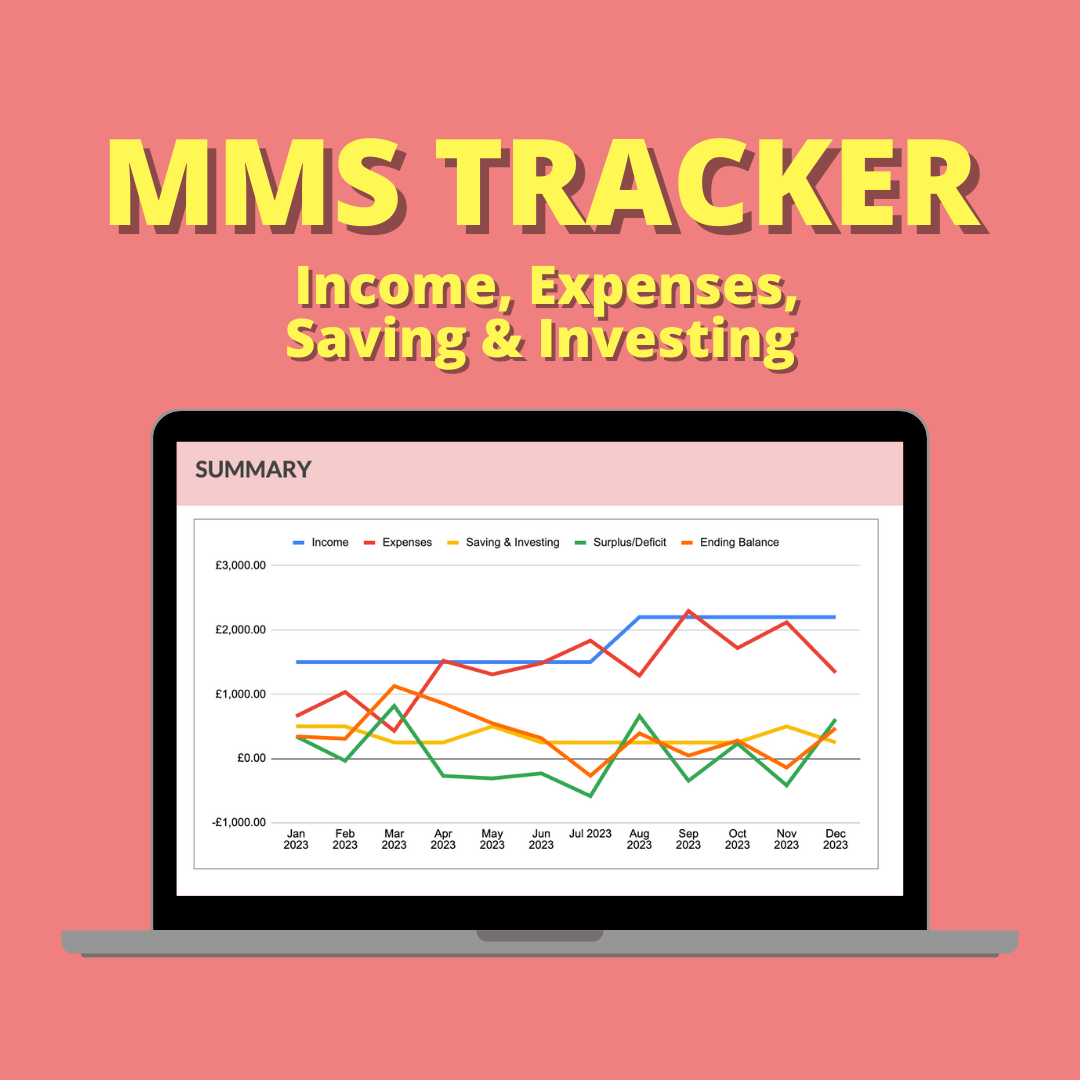


MMS Income, Expenses, Saving & Investing Tracker
A very simple formula-driven spreadsheet to track all of your income, expenses, saving and investing in one place 💰
Simply input your custom categories and transactions throughout the month and this simple tracker will creates graph using this data.
After years of tracking my transactions I found the process to become complicated and tedious.
I wanted, and could never find, a simple formula-driven spreadsheet where I could input my income, expenses, saving and investing each month that would then produce graphs breaking this information down and showing the trends over time.
So... I created this spreadsheet! 💻
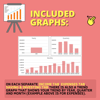
📊 Included Graphs:
- Summary line graph
- Pie chart of the breakdown of income
- Pie chart of the breakdown of expenses
- Pie chart of the breakdown of saving and investing
- Bar graph trends over time of income, expenses, saving and investing
Each of these pie charts can also be filtered by year, quarter, month, date and category to show your data at both higher levels and very granular levels.
💼 What's included in your purchase?
On purchase you will receive a PDF. This PDF includes:
- Clean spreadsheet
- Sample spreadsheet
- Youtube video tutorial to get the most out of the spreadsheet
Please note: This is a digital product.