



Risk Reward Ratio Explained — Measured (PDF Guide)
You were taught to take trades at two-to-one or better, and never told what a two-to-one geometry is worth before the market is consulted. So a score that sounds respectable gets read as skill, when the geometry alone hands a coin the same number.
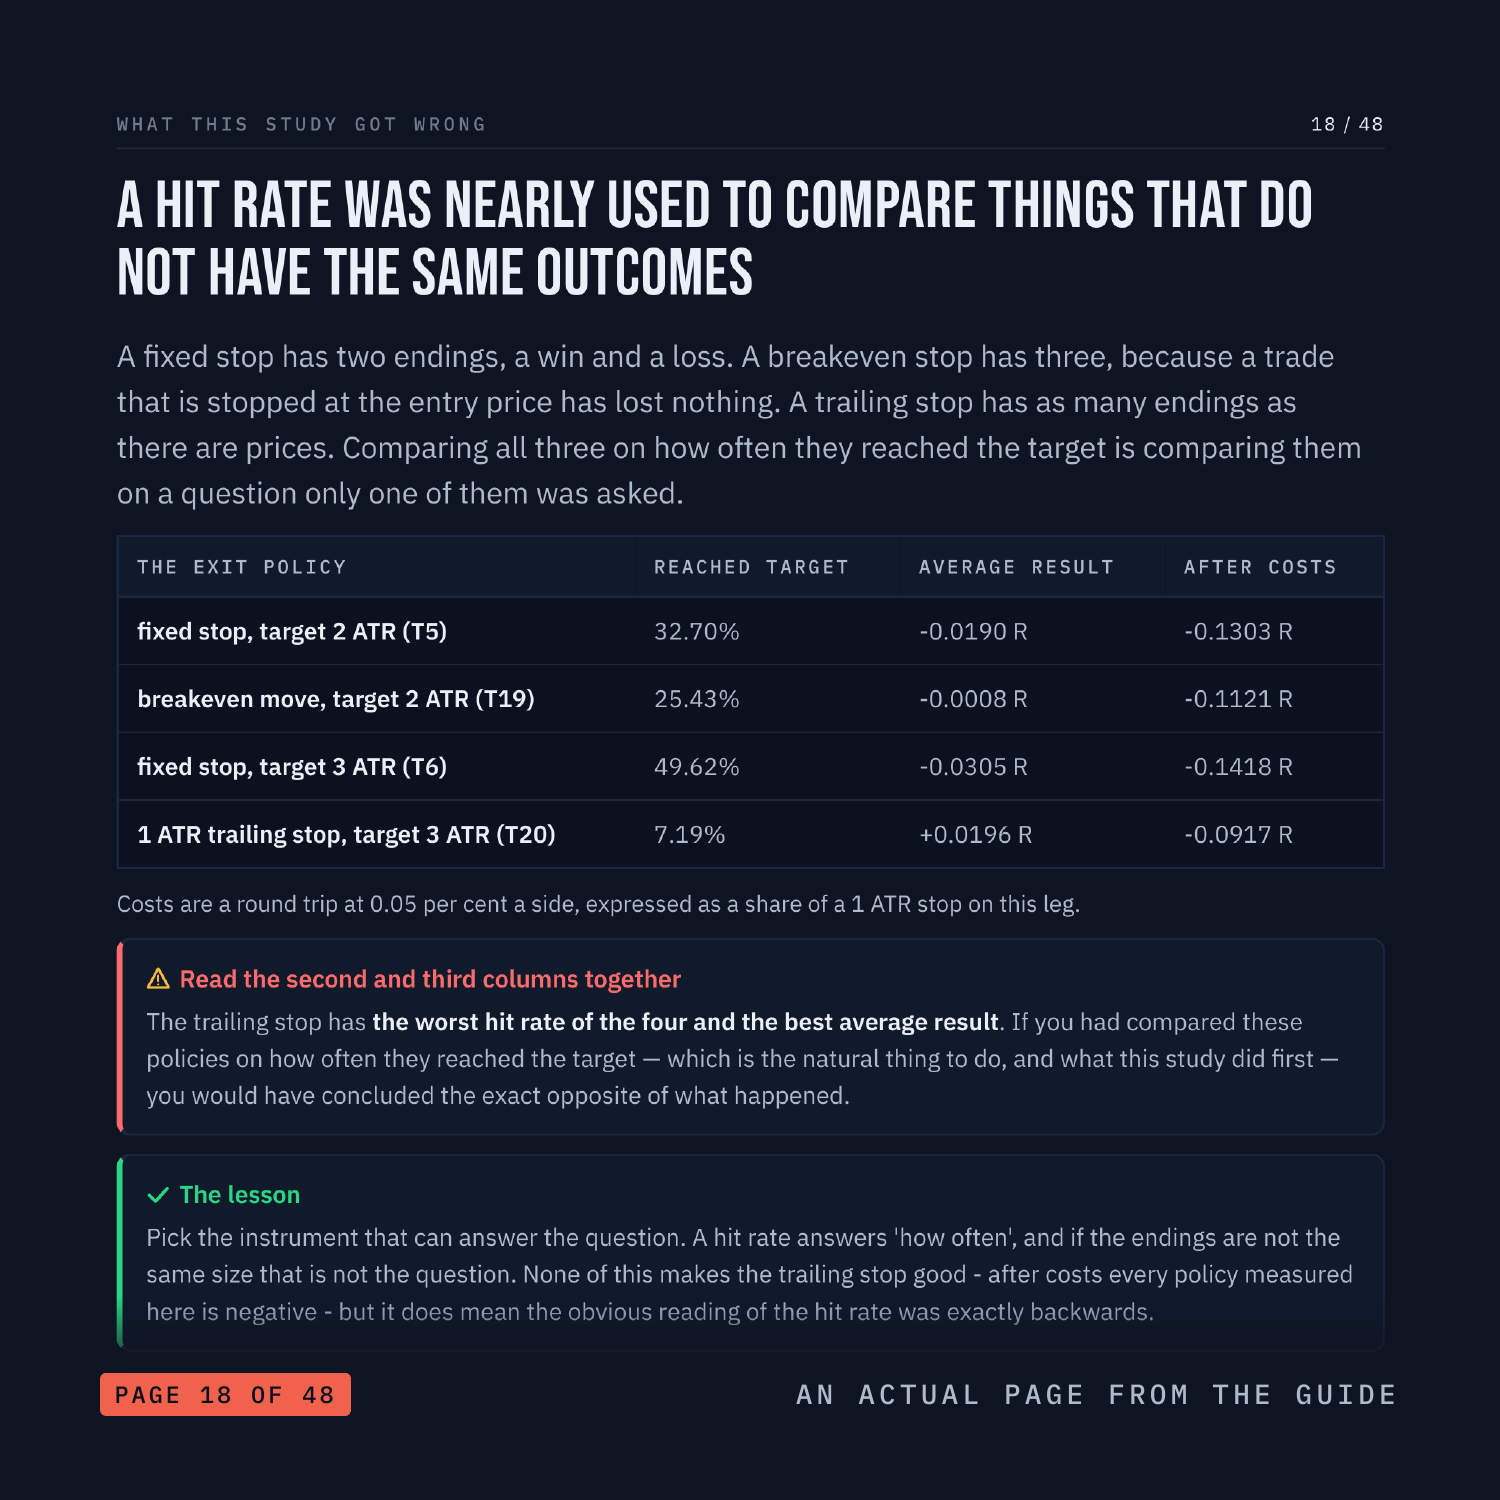
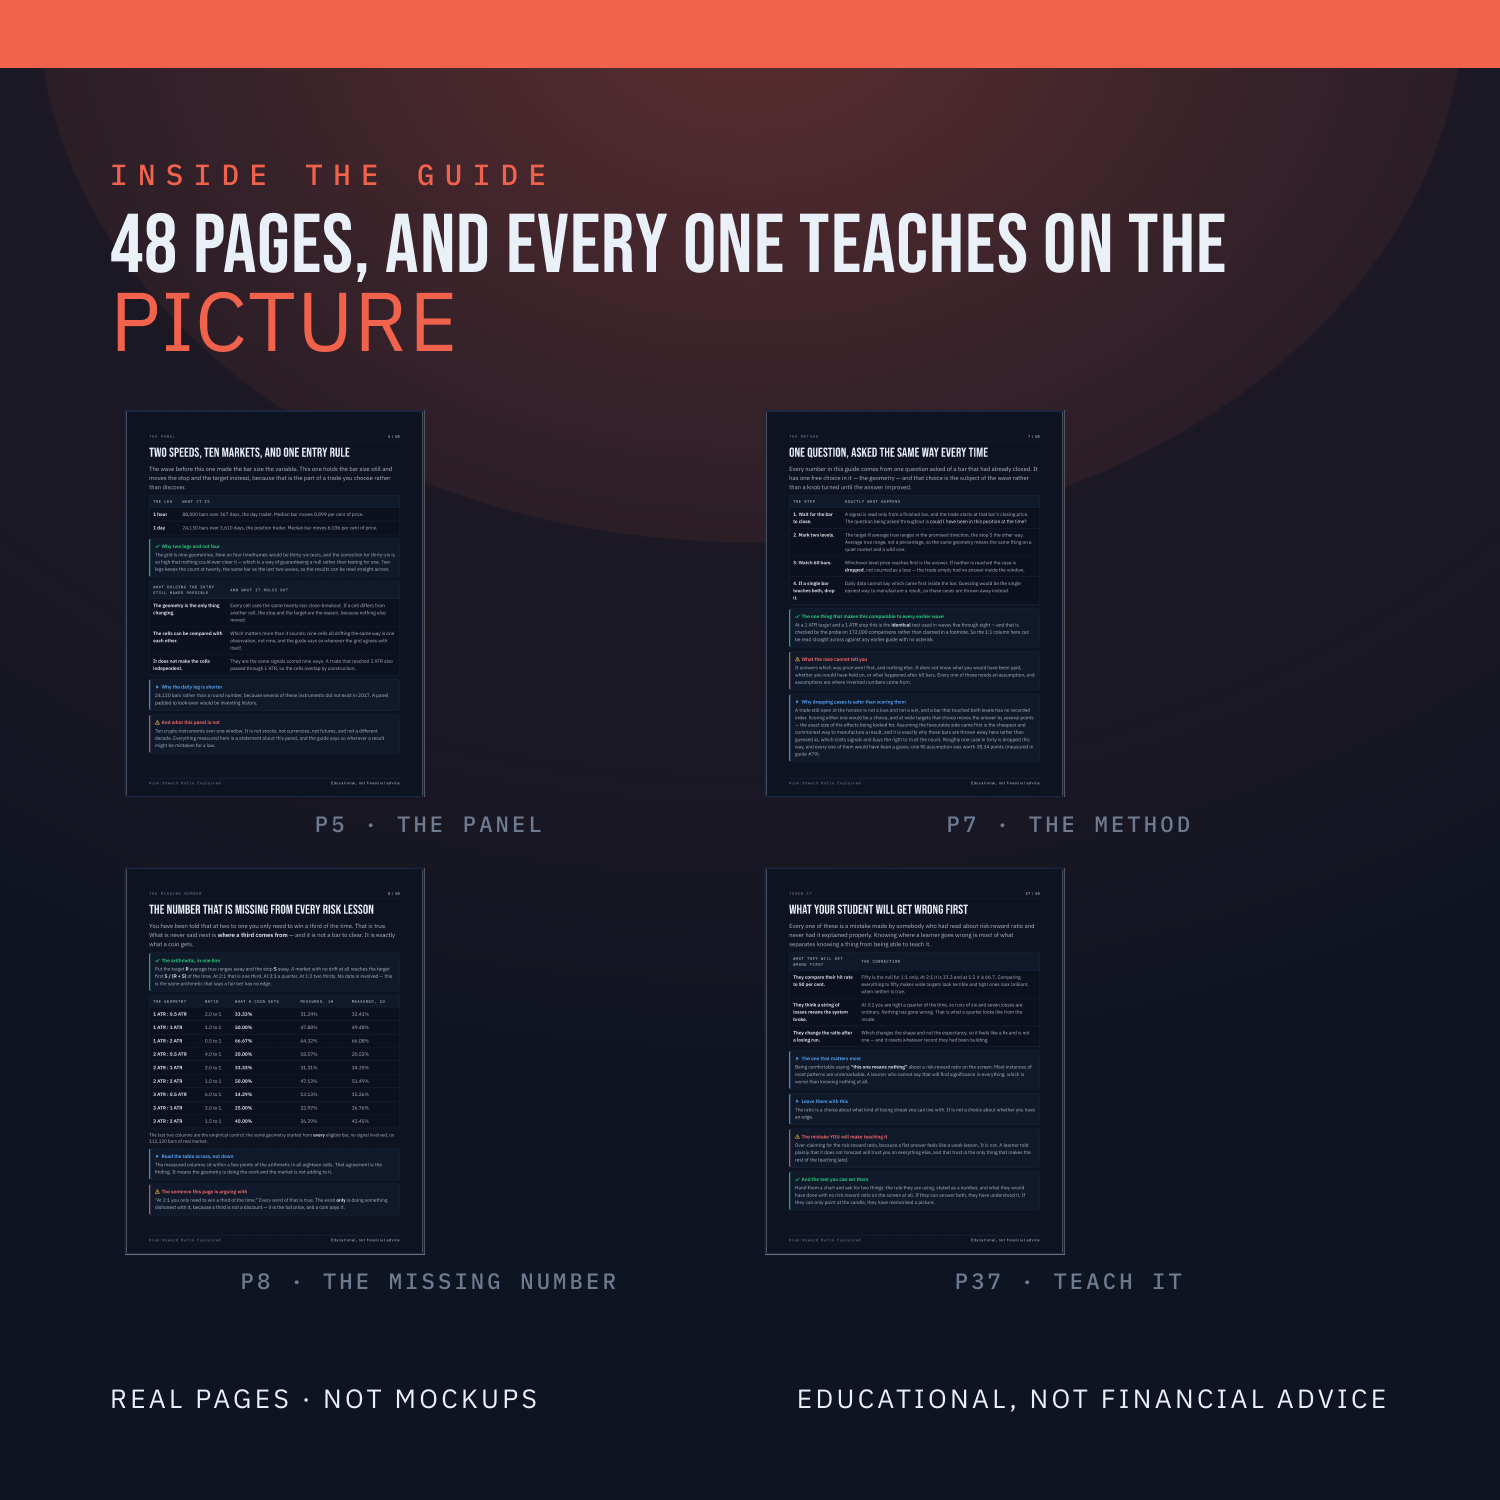
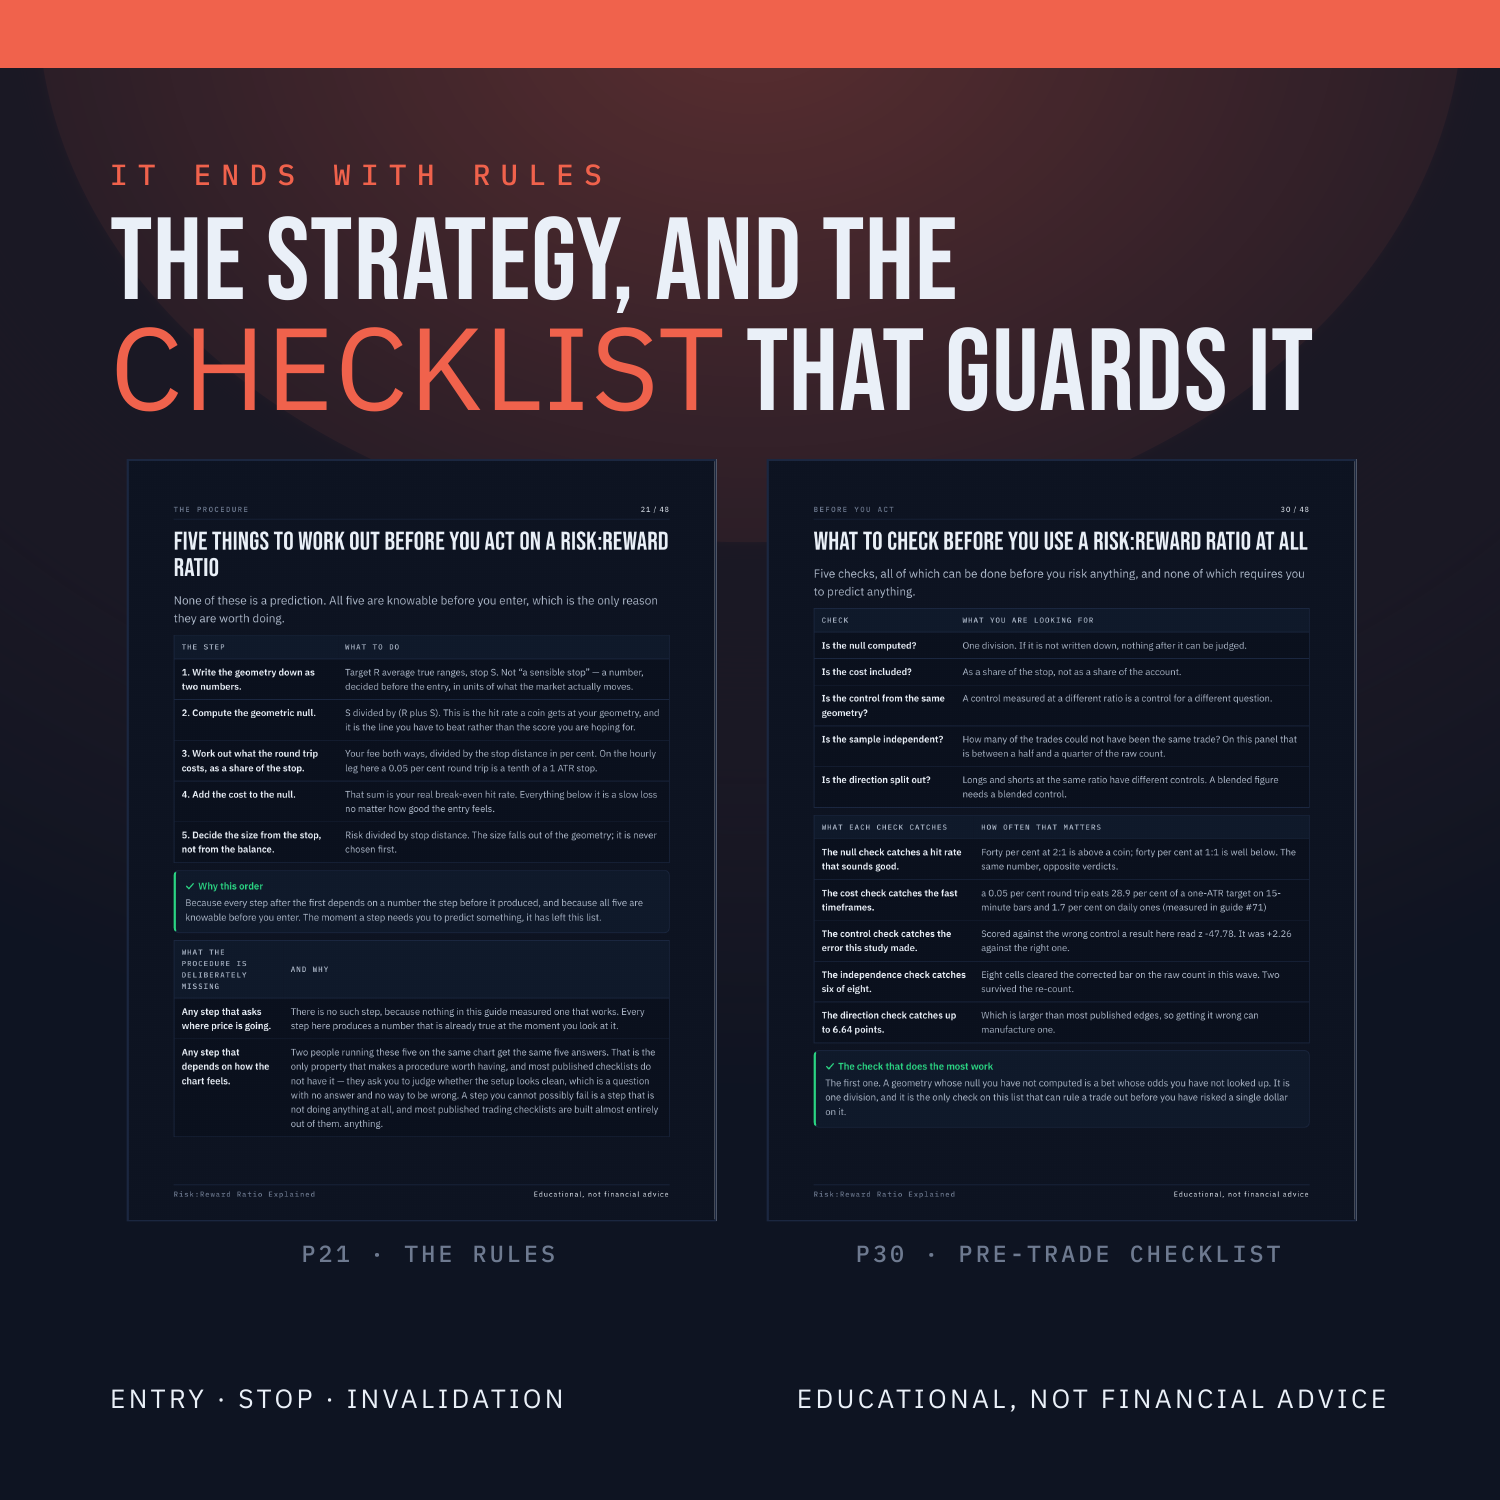
This guide derives the geometric null - the stop divided by the sum of the stop and the target - prints it beside eighteen measured cells on 112,130 bars of real data, and adds what the round trip costs on top. It is arithmetic rather than opinion, so you can check every line of it. This is a 48-page PDF that teaches Risk Reward Ratio from the first thing you see on the screen through to a written strategy with an entry, a stop and an explicit rule for when the trade is wrong.
Nothing is taught underneath a chart. Every label sits on the candle, the line or the level it is describing, on real BTC, ETH, SOL and LINK charts. There are three quizzes on real charts, each followed by the same chart re-shown annotated with the reasoning, plus faded practice pages where the first steps are filled in and you finish the rest.
WHAT'S INSIDE
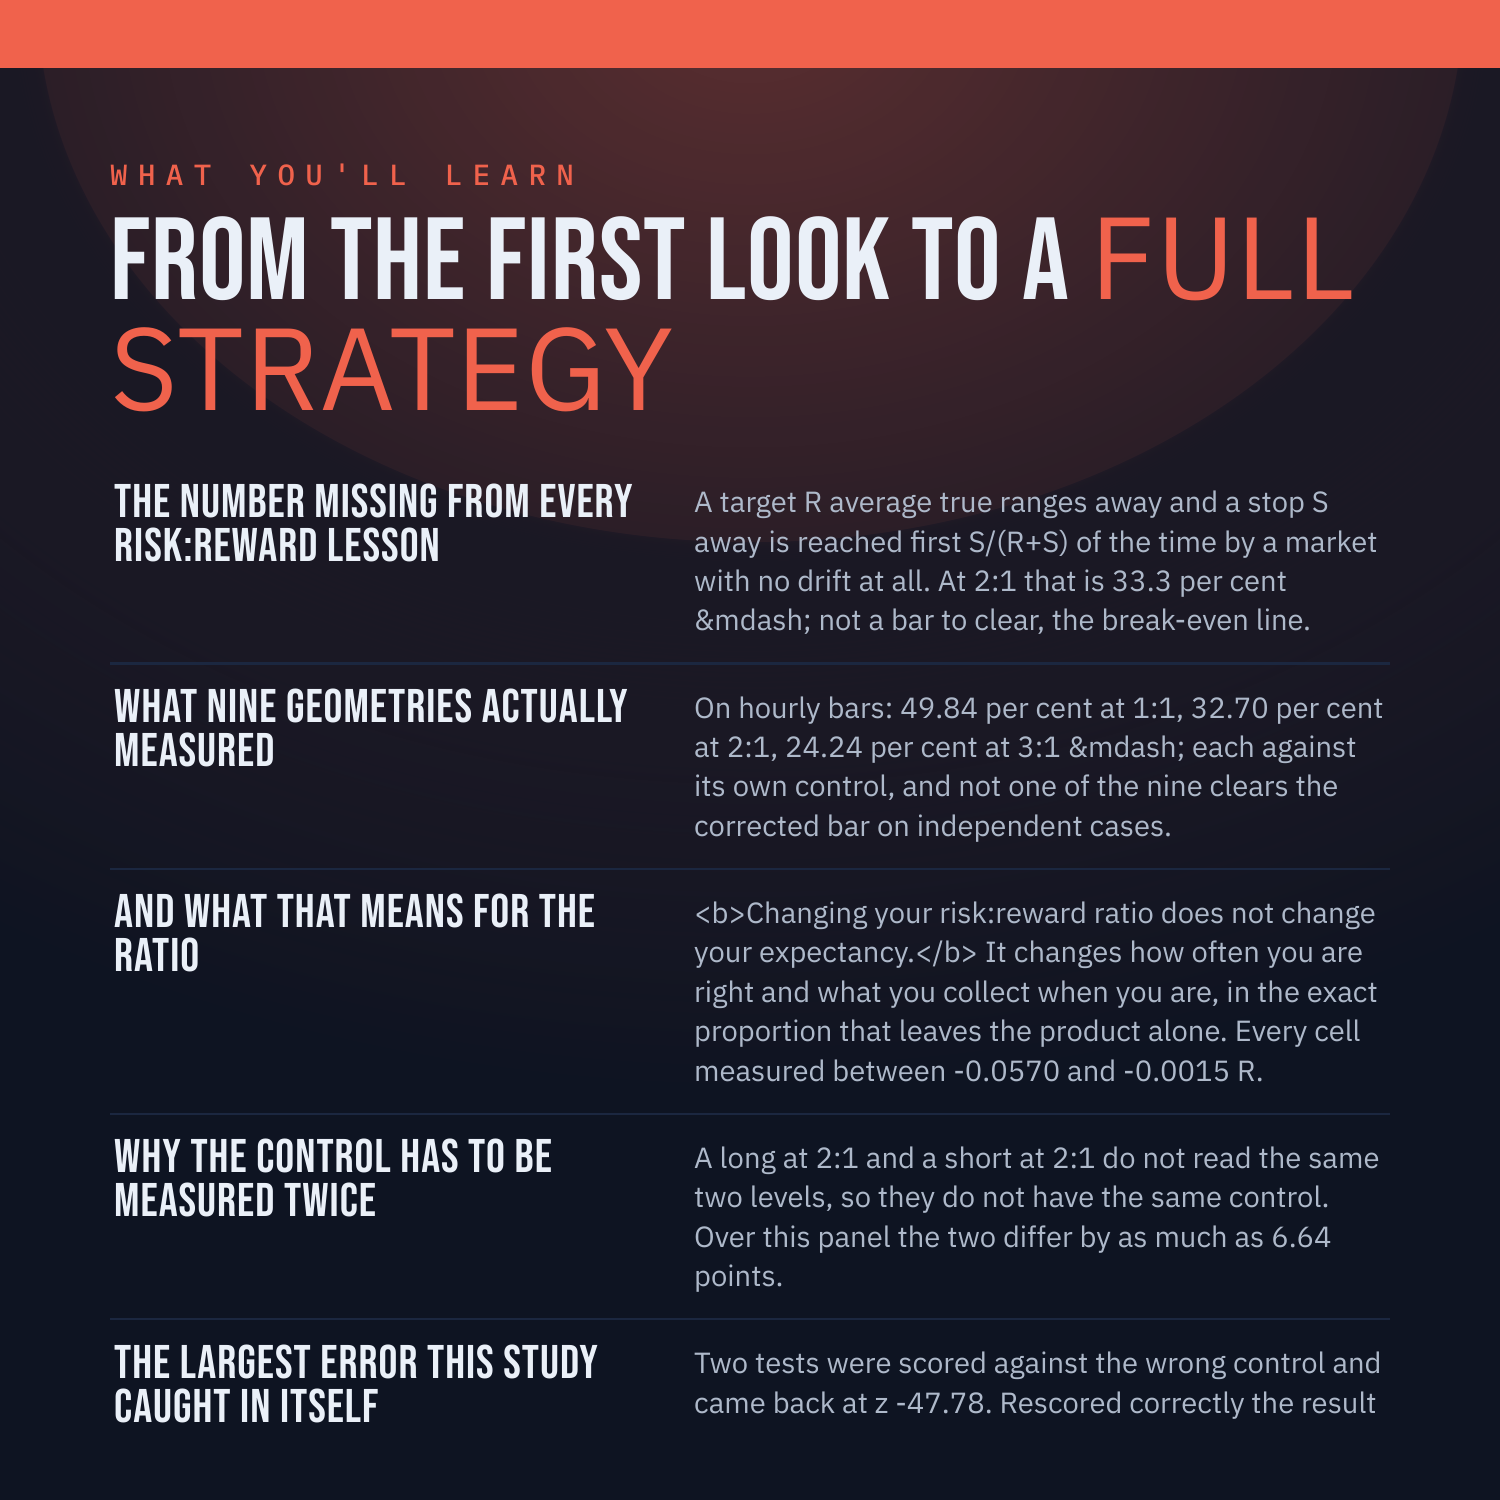
The number missing from every risk:reward lesson -- A target R average true ranges away and a stop S away is reached first S/(R+S) of the time by a market with no drift at all. At 2:1 that is 33.3 per cent -- not a bar to clear, the break-even line.
What nine geometries actually measured -- On hourly bars: 49.84 per cent at 1:1, 32.70 per cent at 2:1, 24.24 per cent at 3:1 -- each against its own control, and not one of the nine clears the corrected bar on independent cases.
And what that means for the ratio -- Changing your risk:reward ratio does not change your expectancy. It changes how often you are right and what you collect when you are, in the exact proportion that leaves the product alone. Every cell measured between -0.0570 and -0.0015 R.
Why the control has to be measured twice -- A long at 2:1 and a short at 2:1 do not read the same two levels, so they do not have the same control. Over this panel the two differ by as much as 6.64 points.
The largest error this study caught in itself -- Two tests were scored against the wrong control and came back at z -47.78. Rescored correctly the result did not shrink -- it changed sign, to +2.26. Printed in full.
WHAT YOU'LL BE ABLE TO DO
Compute the geometric null for any risk:reward ratio in ten seconds.
Tell a good hit rate from one a coin would have got for free.
Say what widening your target does and does not change.
Check whether a control was measured on the same bars as its test.
Read an expectancy in R rather than a hit rate.
AN HONEST NOTE
Risk Reward Ratio is a clue, not a crystal ball. It describes what price has already done. This guide contains no win-rates, no backtest results and no promises about what you will make, because nobody can verify those and you should not trust anyone who prints them. What it hands you instead is a set of rules you can test yourself on TradingView in an afternoon. Educational, not financial advice.
Instant download. 48 pages, PDF.