





Awesome Oscillator Explained — Colour rule (PDF Guide)
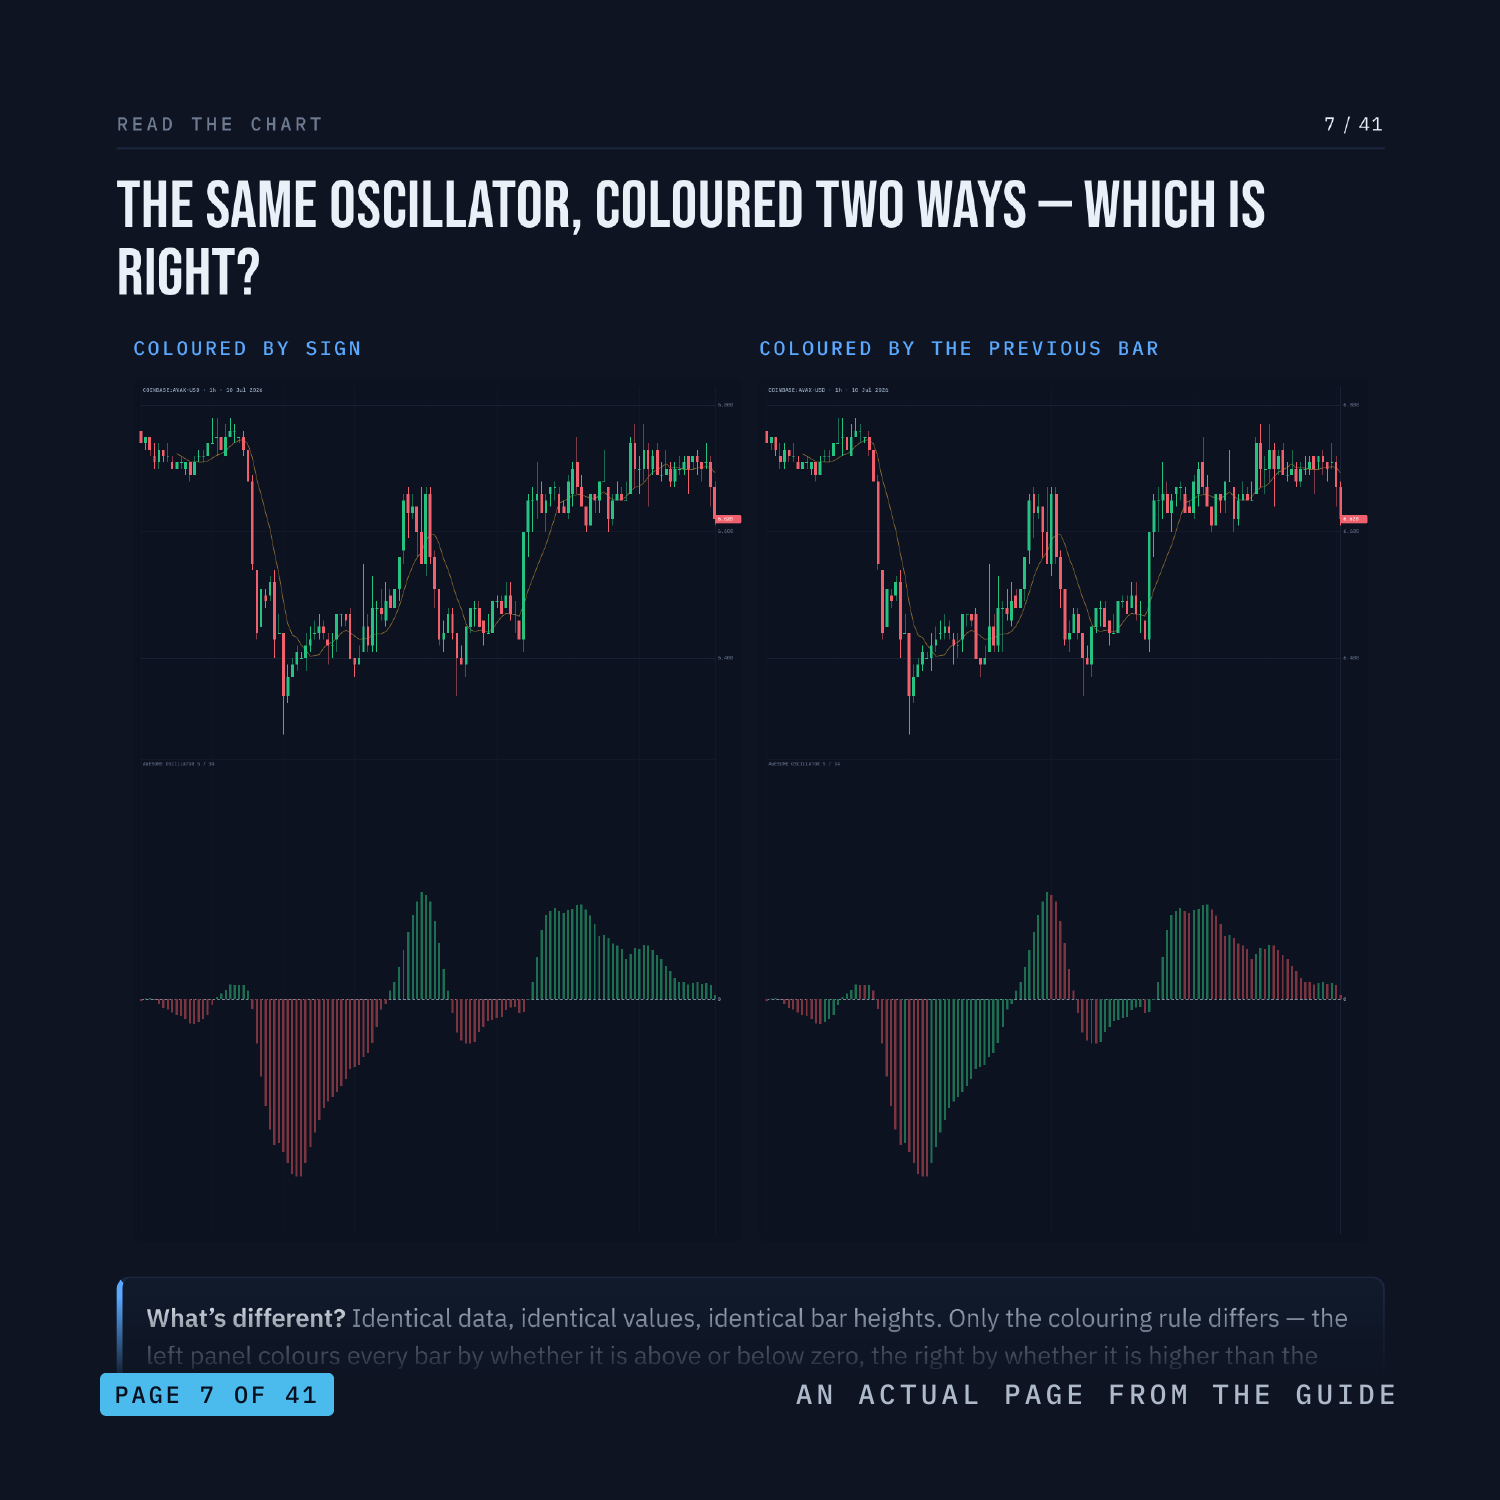
You look at the Awesome Oscillator, see a green bar, and read it as bullish. Then you see a green bar sitting deep below the zero line and it stops making sense. It makes perfect sense - the colour was never telling you what you thought it was.
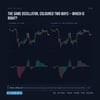
The colour compares each bar to the PREVIOUS bar, not to zero. Measured across 27,840 real bars, 50.1% of bars carry a colour that disagrees with their side of zero. This is a 41-page PDF that teaches the Awesome Oscillator from the first thing you see on the screen through to a written strategy with an entry, a stop and an explicit rule for when the trade is wrong.
Nothing is taught underneath a chart. Every label sits on the bar, the line or the level it is describing, on real market data. There are three quizzes on real charts, each followed by the same chart re-shown annotated with the reasoning, plus faded practice pages where the first steps are filled in and you finish the rest.
WHAT'S INSIDE
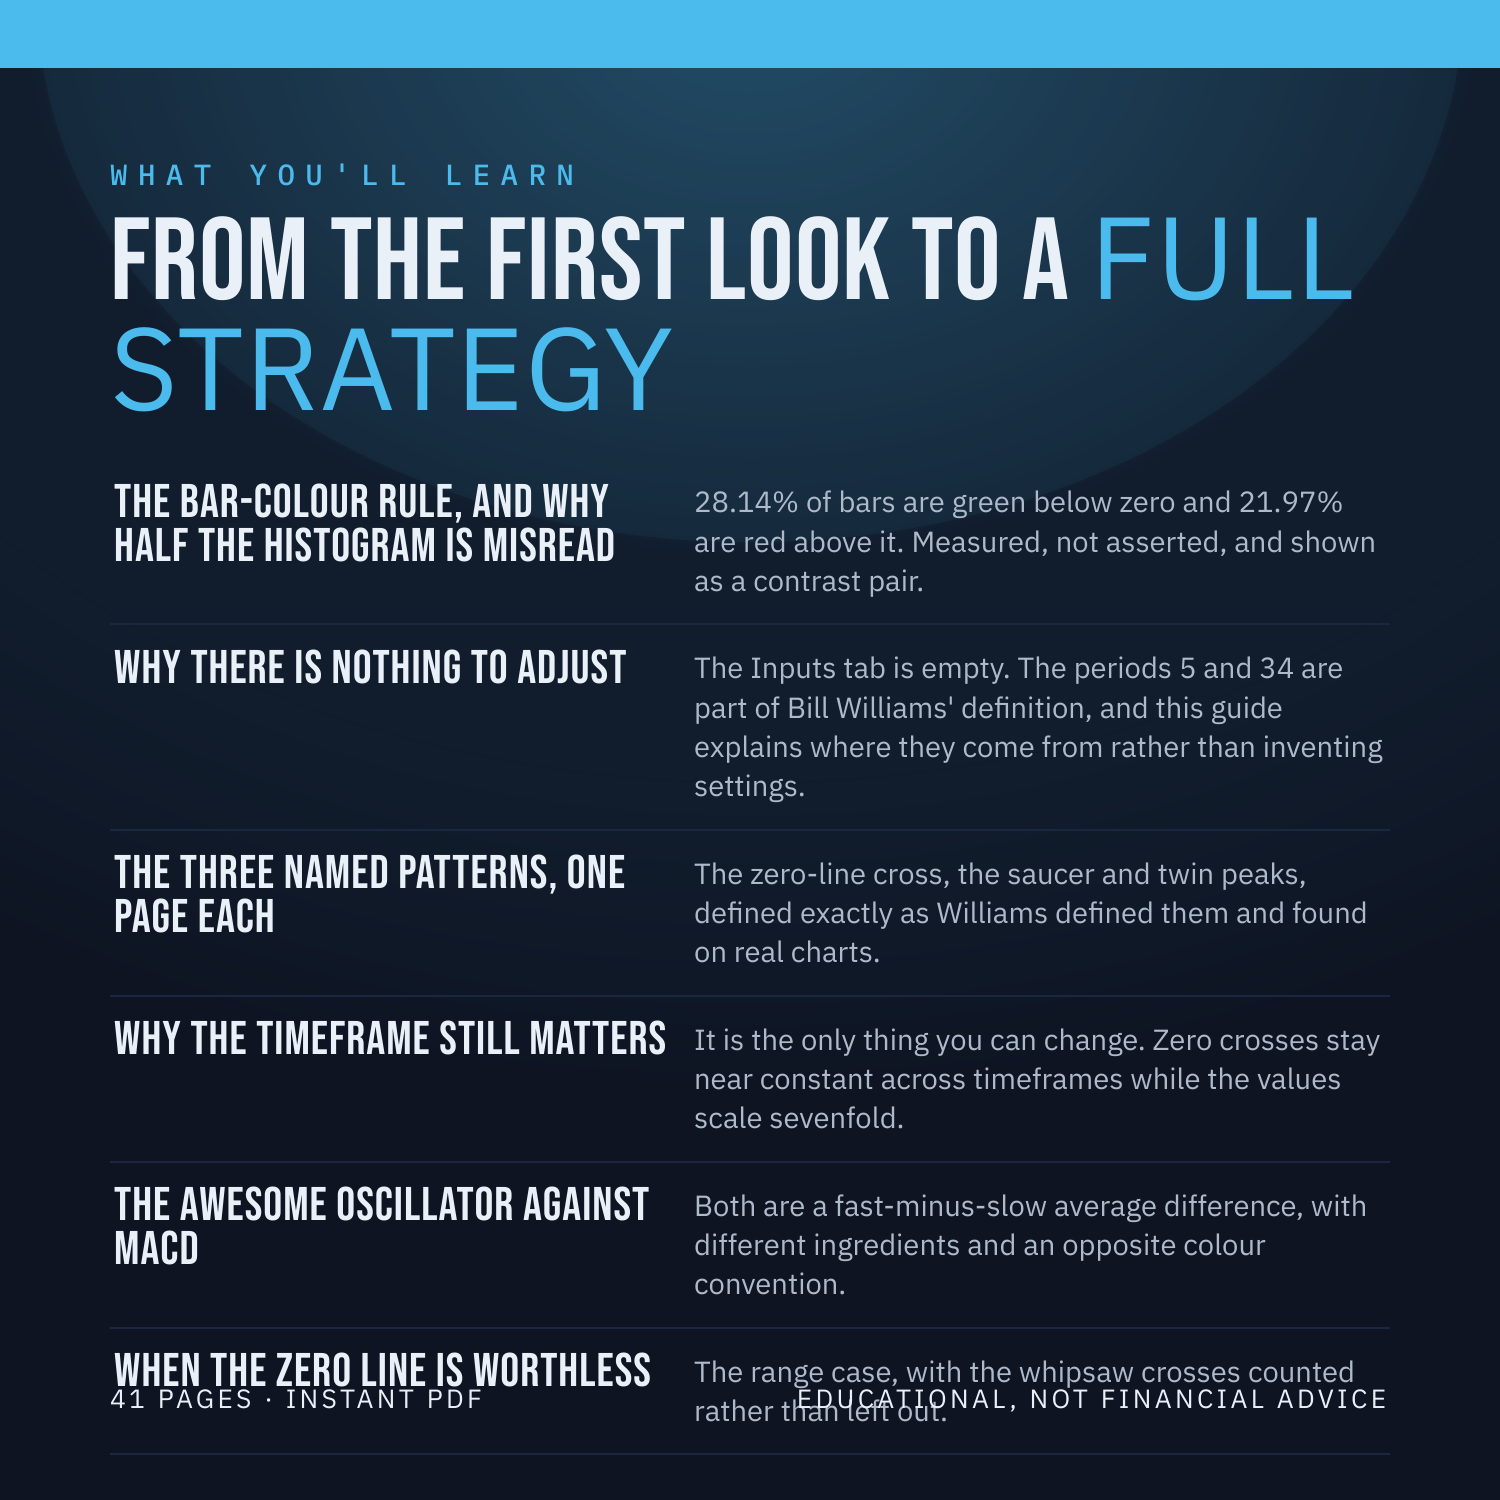
- The bar-colour rule, and why half the histogram is misread — 28.14% of bars are green below zero and 21.97% are red above it. Measured, not asserted, and shown as a contrast pair.
- Why there is nothing to adjust — The Inputs tab is empty. The periods 5 and 34 are part of Bill Williams' definition, and this guide explains where they come from rather than inventing settings.
- The three named patterns, one page each — The zero-line cross, the saucer and twin peaks, defined exactly as Williams defined them and found on real charts.
- Why the timeframe still matters — It is the only thing you can change. Zero crosses stay near constant across timeframes while the values scale sevenfold.
- The Awesome Oscillator against MACD — Both are a fast-minus-slow average difference, with different ingredients and an opposite colour convention.
- When the zero line is worthless — The range case, with the whipsaw crosses counted rather than left out.
WHAT YOU'LL BE ABLE TO DO
- Read any bar's colour correctly, including the ones below zero.
- Explain why a green bar can sit deep in negative territory.
- Spot a saucer and twin peaks by their real definitions.
- Stop looking for settings that do not exist.
- Say what the timeframe changes when nothing else can be changed.
- Tell when the zero line is information and when it is noise.
AN HONEST NOTE
The Awesome Oscillator is a clue, not a crystal ball. It describes what price has already done. This guide contains no win-rates, no backtest results and no promises about what you will make, because nobody can verify those and you should not trust anyone who prints them. What it hands you instead is a set of rules you can test yourself on TradingView in an afternoon. Educational, not financial advice.
Instant download. 41 pages, PDF.