

Supply & Demand Break-Retest [S&D + BOS] Indicator
🟡 Product Description
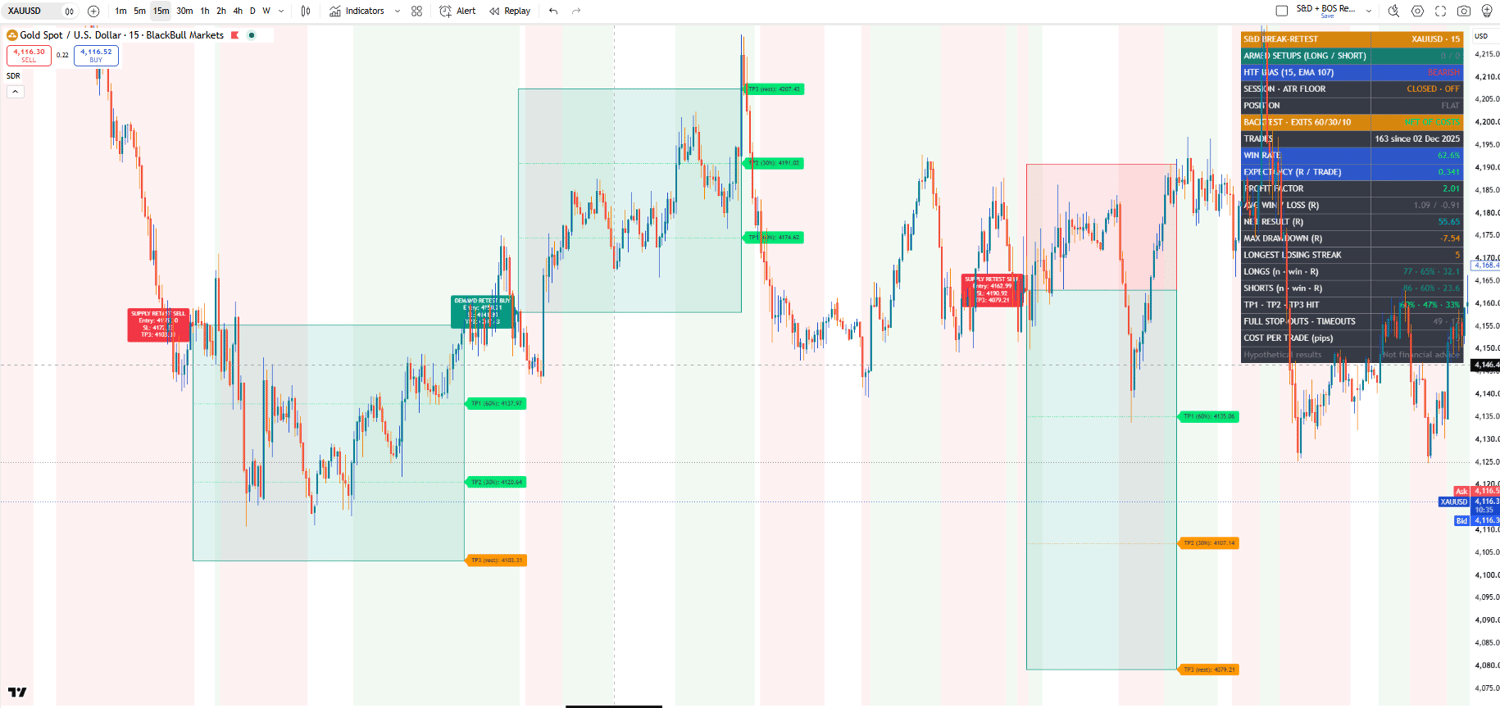
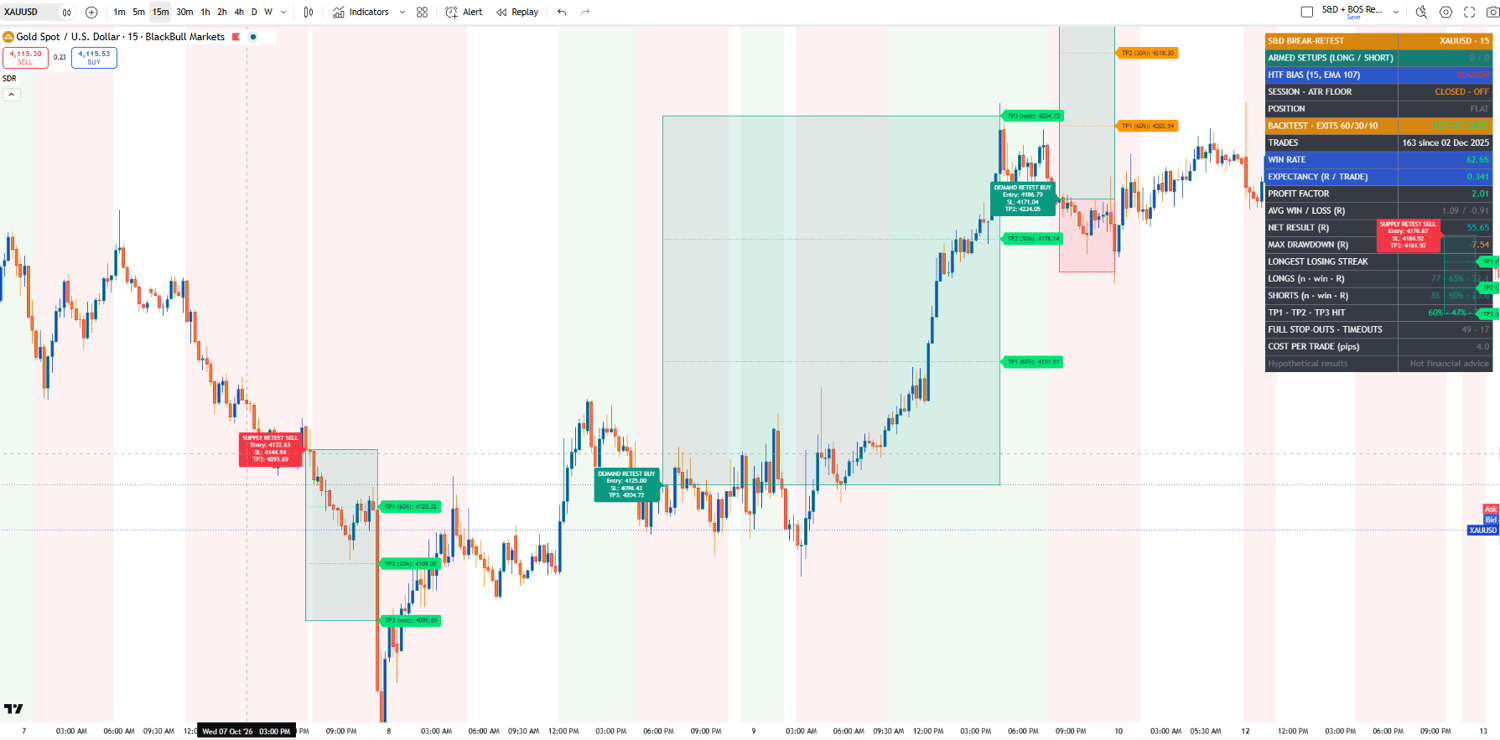
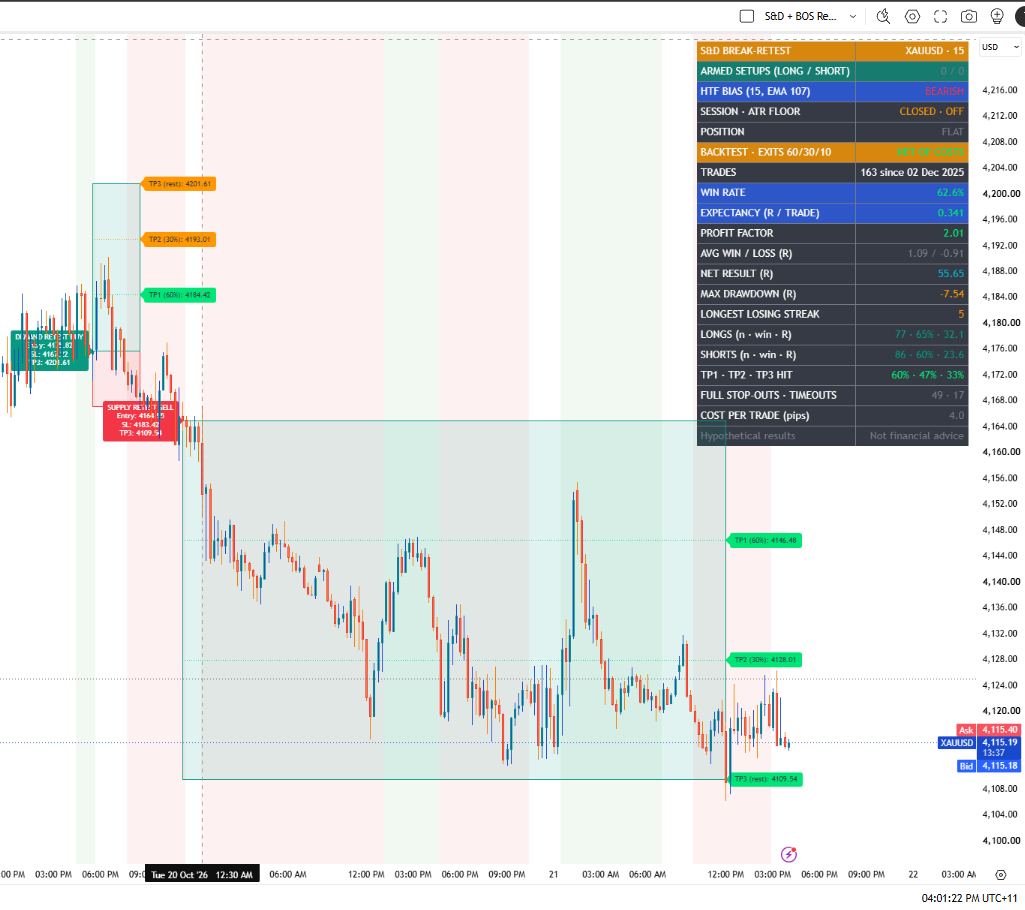
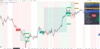
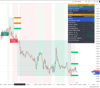
Supply & Demand Break-Retest [S&D + BOS] is a TradingView indicator that trades a classic three-stage pattern: a supply or demand zone forms, price breaks structure away from it, then returns to retest it. Each stage is detected automatically, and every entry comes with a scaled three-target trade plan drawn on your chart.
Most supply and demand tools draw zones and leave you to guess which ones matter. This one only trades a zone after price has confirmed it by breaking structure, then waits for price to return and reject it.
It works in three stages:
- Zone Formation
- Detects a base of candles left behind by an outsized impulse move, at a swing high (supply) or swing low (demand).
- Break of Structure
- Confirms the zone only when price breaks recent structure away from it. Up to three confirmed setups per side wait for a retest at once.
- Retest Entry
- Signals when price returns to a confirmed zone and closes back inside it in the trade direction.
An EMA trend filter keeps entries with the trend, and optional session and volatility filters let you trade only when conditions suit you.
Every trade is managed with scaled exits: partial profits at TP1 and TP2, a tightened stop after TP1, breakeven at TP2, a runner to TP3, and a time limit for trades that stall. Alerts cover each step in plain text, JSON webhook or PineConnector format, and every trade is tracked in a built-in performance dashboard, net of trading costs.
Every signal is confirmed on candle close, so it never repaints. Built under the GoldenDream brand.
🟡 Key Features
- Three-stage setup: zone, break of structure, retest
- Multiple armed setups per side
- Non-repainting: every signal confirmed on candle close
- EMA trend, session and volatility filters
- Scaled exits: 60% at TP1, 30% at TP2, runner to TP3 (all adjustable)
- Entry, SL, TP1, TP2 and TP3 drawn on every trade
- Trade-management alerts: entry, partial closes, stop moves and timeout closes
- Alert formats: plain text, JSON webhook and PineConnector
- Performance dashboard: win rate, expectancy, profit factor, drawdown, losing streaks, long vs short results
- All statistics net of trading costs you set
- No hardcoded symbols
🟡 Backtest Snapshot
XAUUSD, M15, Dec 2025 to Oct 2026, default exits (60% / 30% / 10%), 4-pip cost per trade, EMA 107 trend filter, session filter ([session hours]):
163 trades · 62.6% win rate · +0.34R expectancy · 2.01 profit factor · 7.5R max drawdown · longest losing streak 5
60% of trades reached TP1, 47% reached TP2 and 33% ran to TP3. Both directions were strongly profitable: longs +32.1R across 77 trades and shorts +23.6R across 86 trades.
The win rate includes trades closed in profit at the time limit, which is why it's slightly higher than the TP1 hit rate.
These are hypothetical results based on historical data, not a promise of future performance. Expect losing streaks; the dashboard shows how long they've been historically.
🟡 Genuine, Non-Repainting, Nothing Hidden
Many indicators look perfect on a chart because they repaint: signals shift or vanish after the fact, so only the winners remain. This one doesn't.
- Every signal is confirmed on candle close and never moves or disappears
- Every trade stays on the chart, winners and losers alike
- A "Losers Only" view lets you inspect every losing trade yourself
- Statistics include every trade, charged with trading costs
- When a candle touches both the stop and the target, it counts as a loss
- Drawdown and losing streaks are shown as openly as the wins
You don't have to take our word for it. Load the indicator, look through the losing trades, and judge the statistics yourself.
The indicator gives you a complete, rules-based plan for every trade. Results depend on following it consistently: taking the signals, respecting the stop, and keeping your risk per trade sensible.
🟡 Who This Is For
- Traders who use supply and demand and want rule-based confirmation before entering
- Traders who want a complete scaled trade plan with every signal
- Anyone automating with PineConnector or a webhook bridge
- Traders who want to judge a strategy on its statistics before trusting it
🟡 What's Included
- Supply & Demand Break-Retest indicator (invite-only access on TradingView)
- Performance dashboard
- Entry, partial-close, stop-move and close alerts in all three formats
- Setup guide covering installation, settings and alert setup
- Updates to the indicator
🟡 Requirements
- A TradingView account
- For automation: your own PineConnector subscription or webhook bridge
🟡 Price
USD 300 (one-time license)
Invite-only access granted manually after purchase.
🟡 How to Get Access
After purchasing, contact us at https://payhip.com/GoldenDreamHub/contact with:
- Your TradingView username
- Your order number
Once verified, GoldenDream will grant access to your TradingView account and send you the setup guide.
Unauthorised sharing or redistribution is strictly prohibited.
🟡 Disclaimer🟡 Product Description
Supply & Demand Break-Retest [S&D + BOS] is a TradingView indicator that trades a classic three-stage pattern: a supply or demand zone forms, price breaks structure away from it, then returns to retest it. Each stage is detected automatically, and every entry comes with a scaled three-target trade plan drawn on your chart.
Most supply and demand tools draw zones and leave you to guess which ones matter. This one only trades a zone after price has confirmed it by breaking structure, then waits for price to return and reject it.
It works in three stages:
- Zone Formation
- Detects a base of candles left behind by an outsized impulse move, at a swing high (supply) or swing low (demand).
- Break of Structure
- Confirms the zone only when price breaks recent structure away from it. Up to three confirmed setups per side wait for a retest at once.
- Retest Entry
- Signals when price returns to a confirmed zone and closes back inside it in the trade direction.
An EMA trend filter keeps entries with the trend, and optional session and volatility filters let you trade only when conditions suit you.
Every trade is managed with scaled exits: partial profits at TP1 and TP2, a tightened stop after TP1, breakeven at TP2, a runner to TP3, and a time limit for trades that stall. Alerts cover each step in plain text, JSON webhook or PineConnector format, and every trade is tracked in a built-in performance dashboard, net of trading costs.
Every signal is confirmed on candle close, so it never repaints. Built under the GoldenDream brand.
🟡 Key Features
- Three-stage setup: zone, break of structure, retest
- Multiple armed setups per side
- Non-repainting: every signal confirmed on candle close
- EMA trend, session and volatility filters
- Scaled exits: 60% at TP1, 30% at TP2, runner to TP3 (all adjustable)
- Entry, SL, TP1, TP2 and TP3 drawn on every trade
- Trade-management alerts: entry, partial closes, stop moves and timeout closes
- Alert formats: plain text, JSON webhook and PineConnector
- Performance dashboard: win rate, expectancy, profit factor, drawdown, losing streaks, long vs short results
- All statistics net of trading costs you set
- No hardcoded symbols
🟡 Backtest Snapshot
XAUUSD, M15, Dec 2025 to Oct 2026, default exits (60% / 30% / 10%), 4-pip cost per trade, EMA 107 trend filter, session filter ([session hours]):
163 trades · 62.6% win rate · +0.34R expectancy · 2.01 profit factor · 7.5R max drawdown · longest losing streak 5
60% of trades reached TP1, 47% reached TP2 and 33% ran to TP3. Both directions were strongly profitable: longs +32.1R across 77 trades and shorts +23.6R across 86 trades.
The win rate includes trades closed in profit at the time limit, which is why it's slightly higher than the TP1 hit rate.
These are hypothetical results based on historical data, not a promise of future performance. Expect losing streaks; the dashboard shows how long they've been historically.
🟡 Genuine, Non-Repainting, Nothing Hidden
Many indicators look perfect on a chart because they repaint: signals shift or vanish after the fact, so only the winners remain. This one doesn't.
- Every signal is confirmed on candle close and never moves or disappears
- Every trade stays on the chart, winners and losers alike
- A "Losers Only" view lets you inspect every losing trade yourself
- Statistics include every trade, charged with trading costs
- When a candle touches both the stop and the target, it counts as a loss
- Drawdown and losing streaks are shown as openly as the wins
You don't have to take our word for it. Load the indicator, look through the losing trades, and judge the statistics yourself.
The indicator gives you a complete, rules-based plan for every trade. Results depend on following it consistently: taking the signals, respecting the stop, and keeping your risk per trade sensible.
🟡 Who This Is For
- Traders who use supply and demand and want rule-based confirmation before entering
- Traders who want a complete scaled trade plan with every signal
- Anyone automating with PineConnector or a webhook bridge
- Traders who want to judge a strategy on its statistics before trusting it
🟡 What's Included
- Supply & Demand Break-Retest indicator (invite-only access on TradingView)
- Performance dashboard
- Entry, partial-close, stop-move and close alerts in all three formats
- Setup guide covering installation, settings and alert setup
- Updates to the indicator
🟡 Requirements
- A TradingView account
- For automation: your own PineConnector subscription or webhook bridge
🟡 Price
USD [XX] (one-time license)
Invite-only access granted manually after purchase.
🟡 How to Get Access
After purchasing, contact us at https://payhip.com/GoldenDreamHub/contact with:
- Your TradingView username
- Your order number
Once verified, GoldenDream will grant access to your TradingView account and send you the setup guide.
Unauthorised sharing or redistribution is strictly prohibited.
🟡 Disclaimer
Trading involves risk; only trade with money you can afford to lose. Results shown are hypothetical and based on historical data. Past performance does not guarantee future results. This product is a tool, not financial advice. Always test automation on a demo account before going live.