

Handbook of 7 QC Tools | Narender Sharma
On Sale
$25.00
$25.00
eBook Specifications:-
Section1: Introduction of 7 QC Tools
Section10: Self-assessment Exercise with 60MCQs
Section11: Introduction of KAIZEN
Section12: Introduction of 5S Methodology
About The Facilitator/Author
- eBook Format: PDF
- Language: English
- Categories: 7 QC Tools, Lean Six Sigma, Total Quality Management
- File Size: 5MB
- Pages: 86
- Orientation: Landscape
- Facilitator/Author: Narender Sharma
Section1: Introduction of 7 QC Tools
- Development
- Usages
- Application
- Expertise
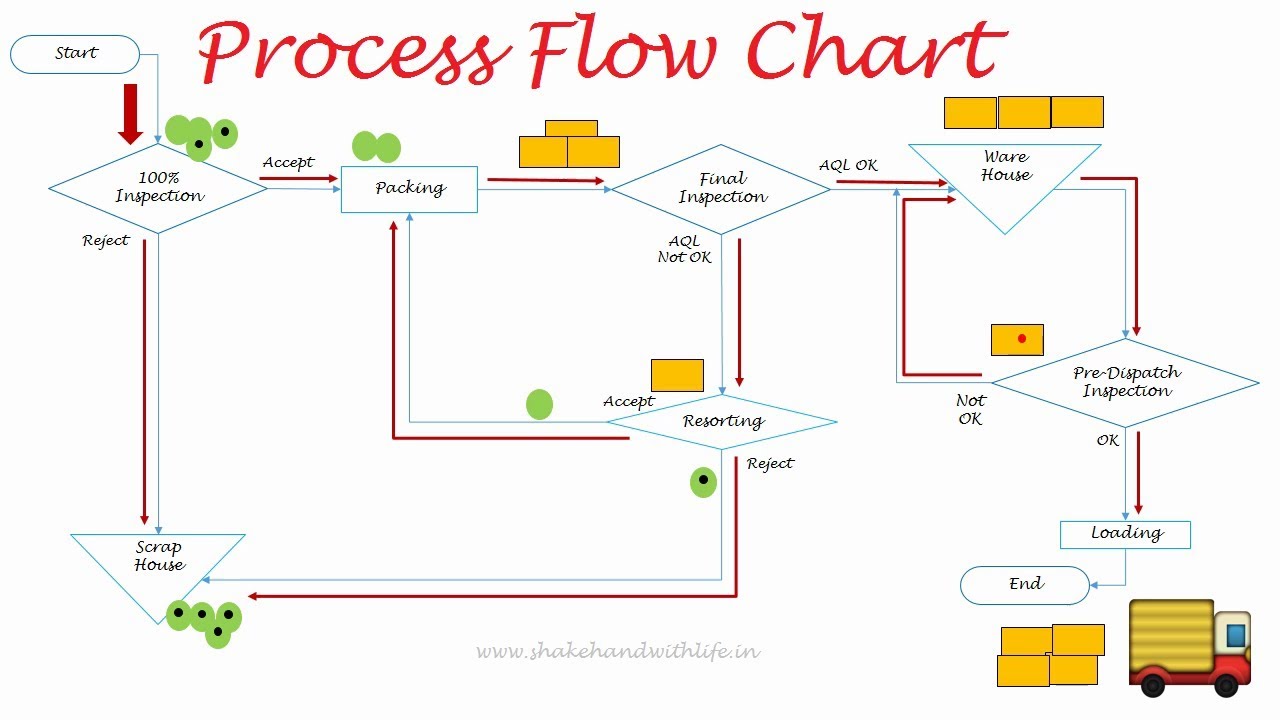
- What is a process flow diagram?
- Application and usages of process flow diagram
- Symbols used to make a process flow diagram
- Steps to construct a process flow diagram
- Illustrative practical examples
- Measuring cycle time
- Process efficiency
- What is a check sheet?
- Application and usages of check sheet
- Steps to construct a check sheet
- Illustrative practical examples
- What is a Histogram?
- Analysis of different shapes of a histogram
- Application and usages of a histogram
- Steps to construct a histogram for ungrouped data
- Steps to construct a histogram for grouped data
- Illustrative examples
- Steps to construct a histogram in Excel
- What is a Pareto chart?
- About Alfredo Pareto?
- ABC analysis and 80-20 rule
- Application and usages of Pareto chart
- Steps to construct a Pareto chart
- Steps to construct a Pareto chart in Excel with excel commands and graphics
- Illustrative examples
- What is a Cause and Effect Diagram?
- Application and usages of C&E diagram
- Steps to construct a Cause and Effect diagram?
- Illustrative Examples
- What is a Scatter Diagram?
- Application and usages of scatter diagram?
- Interpretation of different patterns of scatter diagram e.g. Perfect positive correlation, Perfect negative correlation, high degree of positive correlation, high degree of negative correlation
- Correlation coefficient (Algebraic value of a relationship between two variables)
- The formula for the Correlation coefficient
- Steps to calculate correlation coefficient 'r'
- Interpretation of correlation coefficient 'r'
- Steps to construct a scatter diagram
- Steps to construct a scatter diagram in Excel
- Illustrative examples
- What is Control Chart?
- Types of control charts
- Concept of accuracy and precision
- Application and usages of control charts
- Impact on quality by continuous use of control charts
- Steps to construct a mean chart
- Steps to construct a mean chart in Excel
- Steps to construct a range chart
- Steps to construct a range chart in Excel
- Illustrative examples
Section10: Self-assessment Exercise with 60MCQs
Section11: Introduction of KAIZEN
Section12: Introduction of 5S Methodology
About The Facilitator/Author
- Author (Narender Sharma) is a coach and consultant of Quality Excellence and Lean Six Sigma.
- Earned 20 years of cross-industry experience including 13years of strong working experience as a quality professional in 'In-process inspection' in Hindusthan National Glass and Ind. Ltd. (HNG) since 2001-2014
- MBA Production and Operation Management
- B.Sc. Electronics, B.Ed